Fig. 10
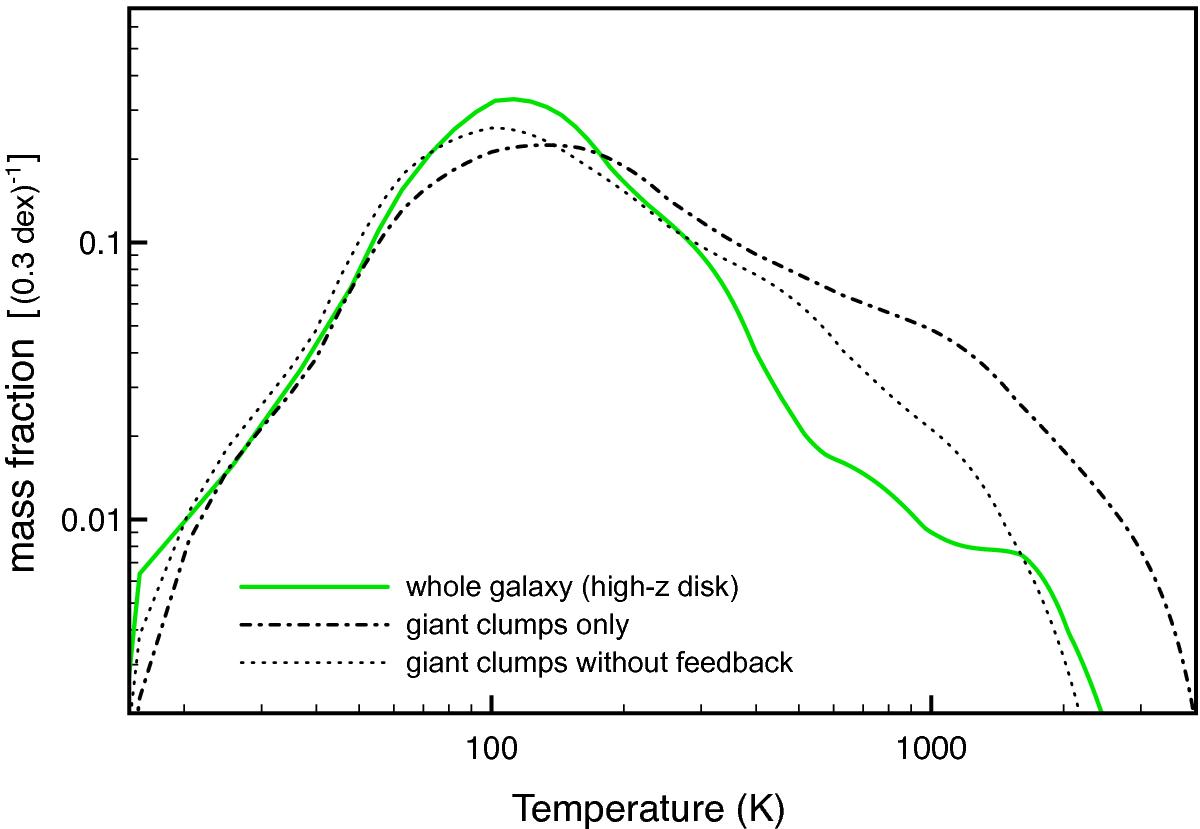
Temperature PDF for the high-z disk snapshot from Figs. 3 and 4, showing the temperature distribution of gas in the 103−104 cm-3 density range (i.e. moderately dense molecular gas). The thick green line is for the entire galaxy and thick dashed line for the giant clumps alone (selected as in Fig. 3), and the thin dashed line is for the giant clumps in the same simulation rerun without stellar feedback for 50 Myr before the analyzed instant.
Current usage metrics show cumulative count of Article Views (full-text article views including HTML views, PDF and ePub downloads, according to the available data) and Abstracts Views on Vision4Press platform.
Data correspond to usage on the plateform after 2015. The current usage metrics is available 48-96 hours after online publication and is updated daily on week days.
Initial download of the metrics may take a while.