Free Access
Fig. 7
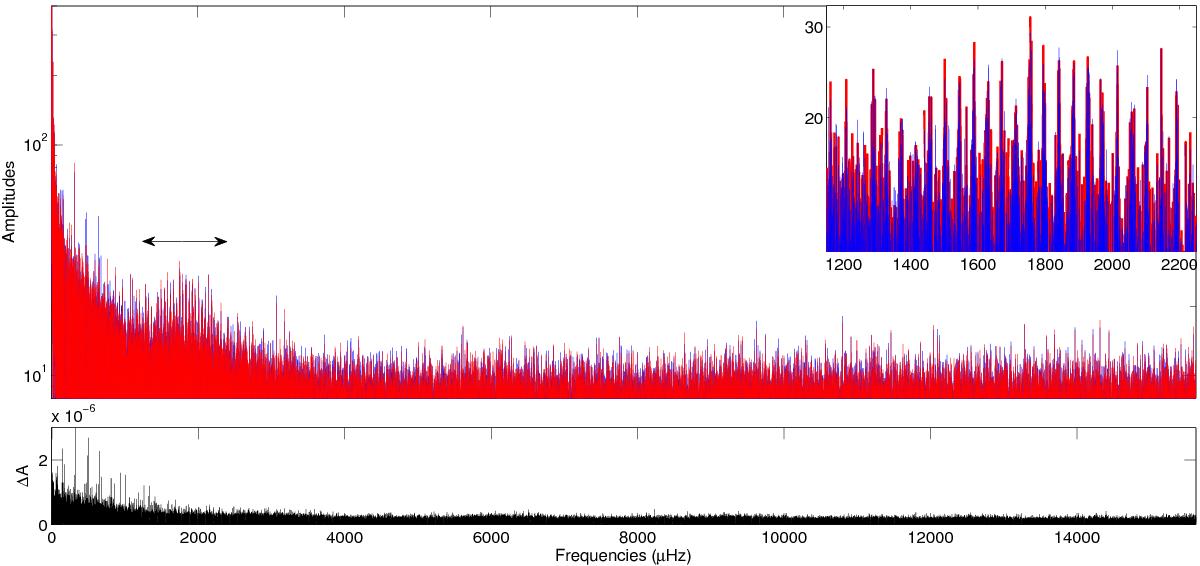
Periodogram of HD 49933 coming from data linearly interpolated (blue), and ARMA interpolation (red). The plotting order is inverted in the inset because the peaks in the p-mode region are higher for the periodogram of ARMA-interpolated data. Lower panel: absolute differences in amplitude between the two methods.
Current usage metrics show cumulative count of Article Views (full-text article views including HTML views, PDF and ePub downloads, according to the available data) and Abstracts Views on Vision4Press platform.
Data correspond to usage on the plateform after 2015. The current usage metrics is available 48-96 hours after online publication and is updated daily on week days.
Initial download of the metrics may take a while.