Fig. 6
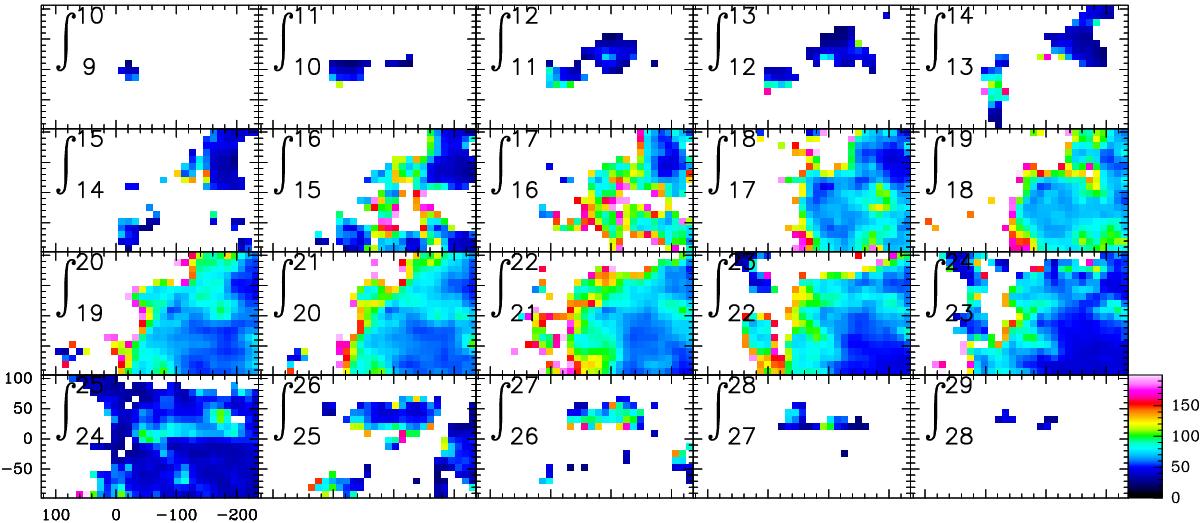
Velocity channel maps (at 1 km s-1 width) of the [C I] excitation temperature (color map in K) in M17 SW, estimated from the R = I([C I] 369 μm)/I([C I] 609 μm) line intensity ratio, and assuming LTE conditions and optically thin emission. Only velocity channels and pixels with emission larger than 3σ in both [C I] lines are shown.
Current usage metrics show cumulative count of Article Views (full-text article views including HTML views, PDF and ePub downloads, according to the available data) and Abstracts Views on Vision4Press platform.
Data correspond to usage on the plateform after 2015. The current usage metrics is available 48-96 hours after online publication and is updated daily on week days.
Initial download of the metrics may take a while.