Fig. 5
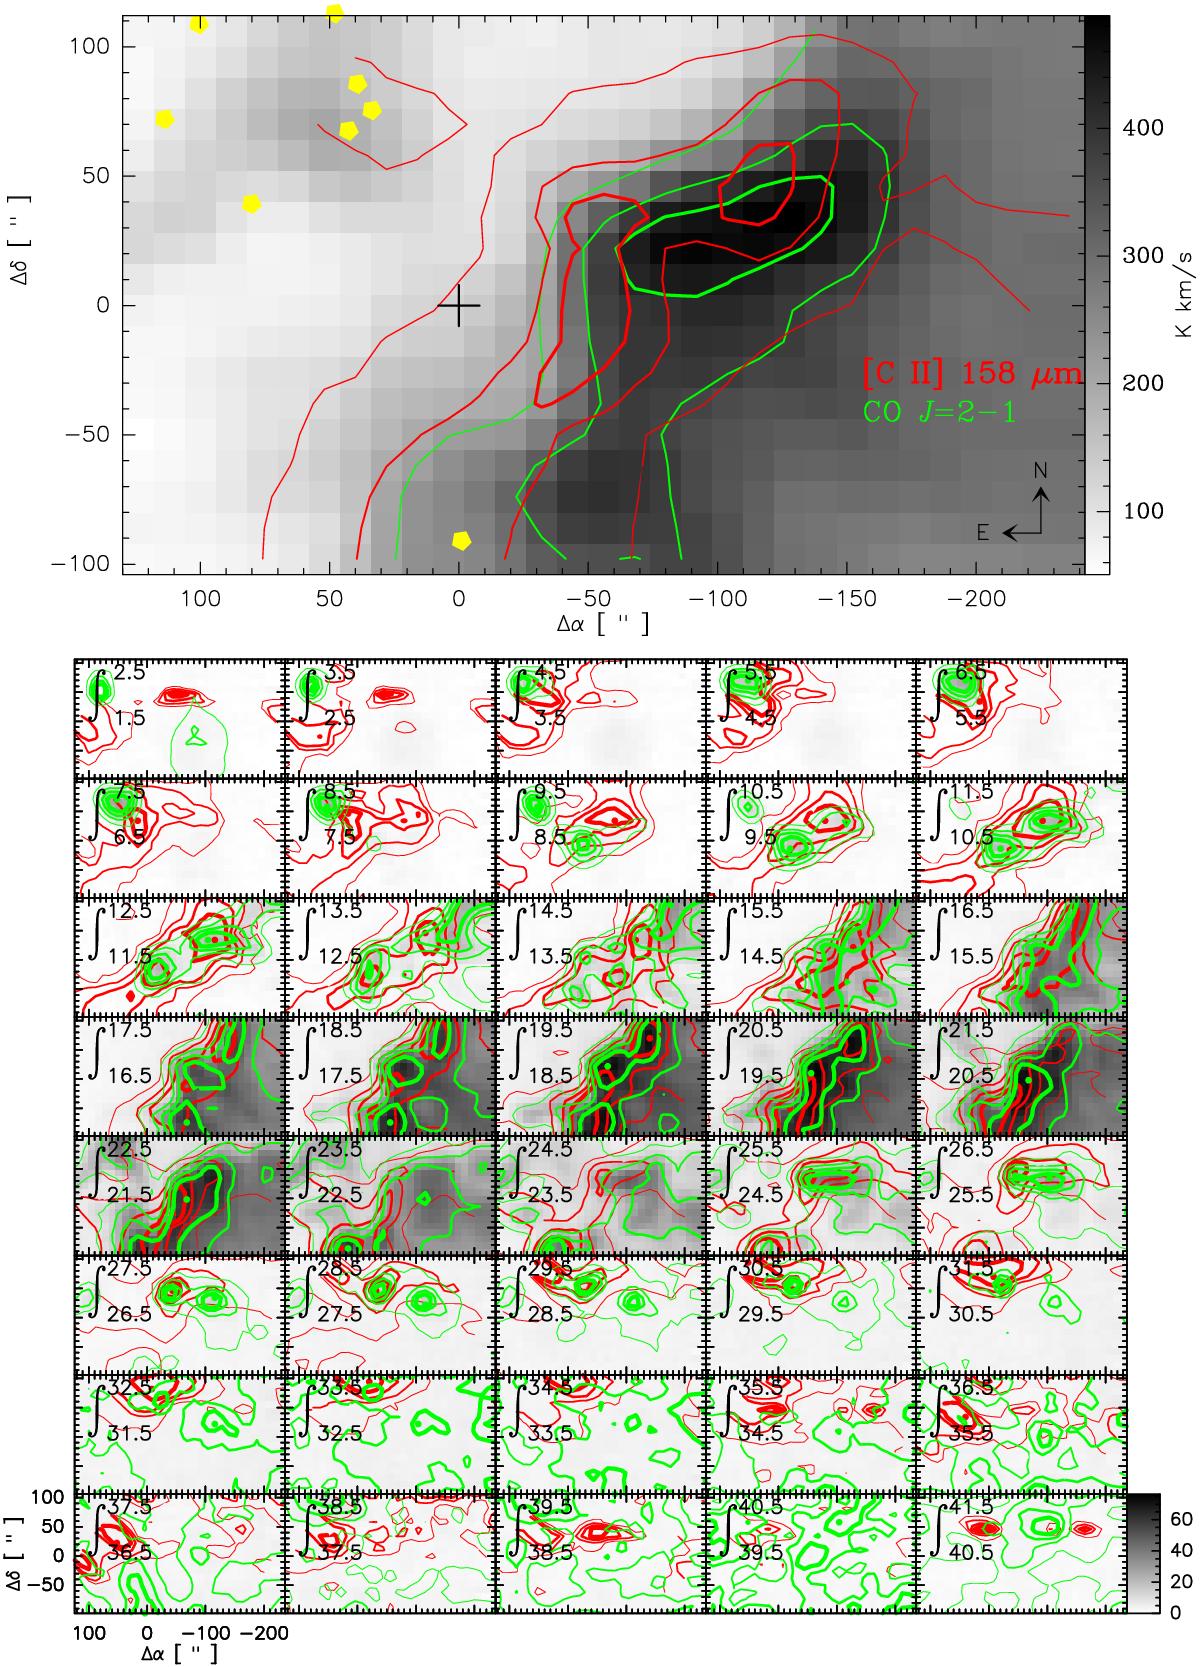
Top: velocity-integrated intensity maps of 12CO J = 1 → 0 (gray), [C II] 158 μm (red contour), and 12CO J = 2 → 1 (green contour). The contour lines (from thin to thick) are 50%, 75%, and 90% of the respective peak emissions. The stars indicate the O and B ionizing stars (Beetz et al. 1976; Hanson et al. 1997). The reference position (Δα = 0, Δδ = 0), marked with a cross, is as in Fig. 2. Bottom: velocity channel maps (at 1 km s-1 width) of the same lines as above. Contours are 20%, 40%, 60%, 80%, and 100% of the respective peak emissions. All maps have been convolved with the largest beam of 24′′ corresponding to the C![]() O J = 1 → 0 map.
O J = 1 → 0 map.
Current usage metrics show cumulative count of Article Views (full-text article views including HTML views, PDF and ePub downloads, according to the available data) and Abstracts Views on Vision4Press platform.
Data correspond to usage on the plateform after 2015. The current usage metrics is available 48-96 hours after online publication and is updated daily on week days.
Initial download of the metrics may take a while.