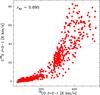
Fig. 4
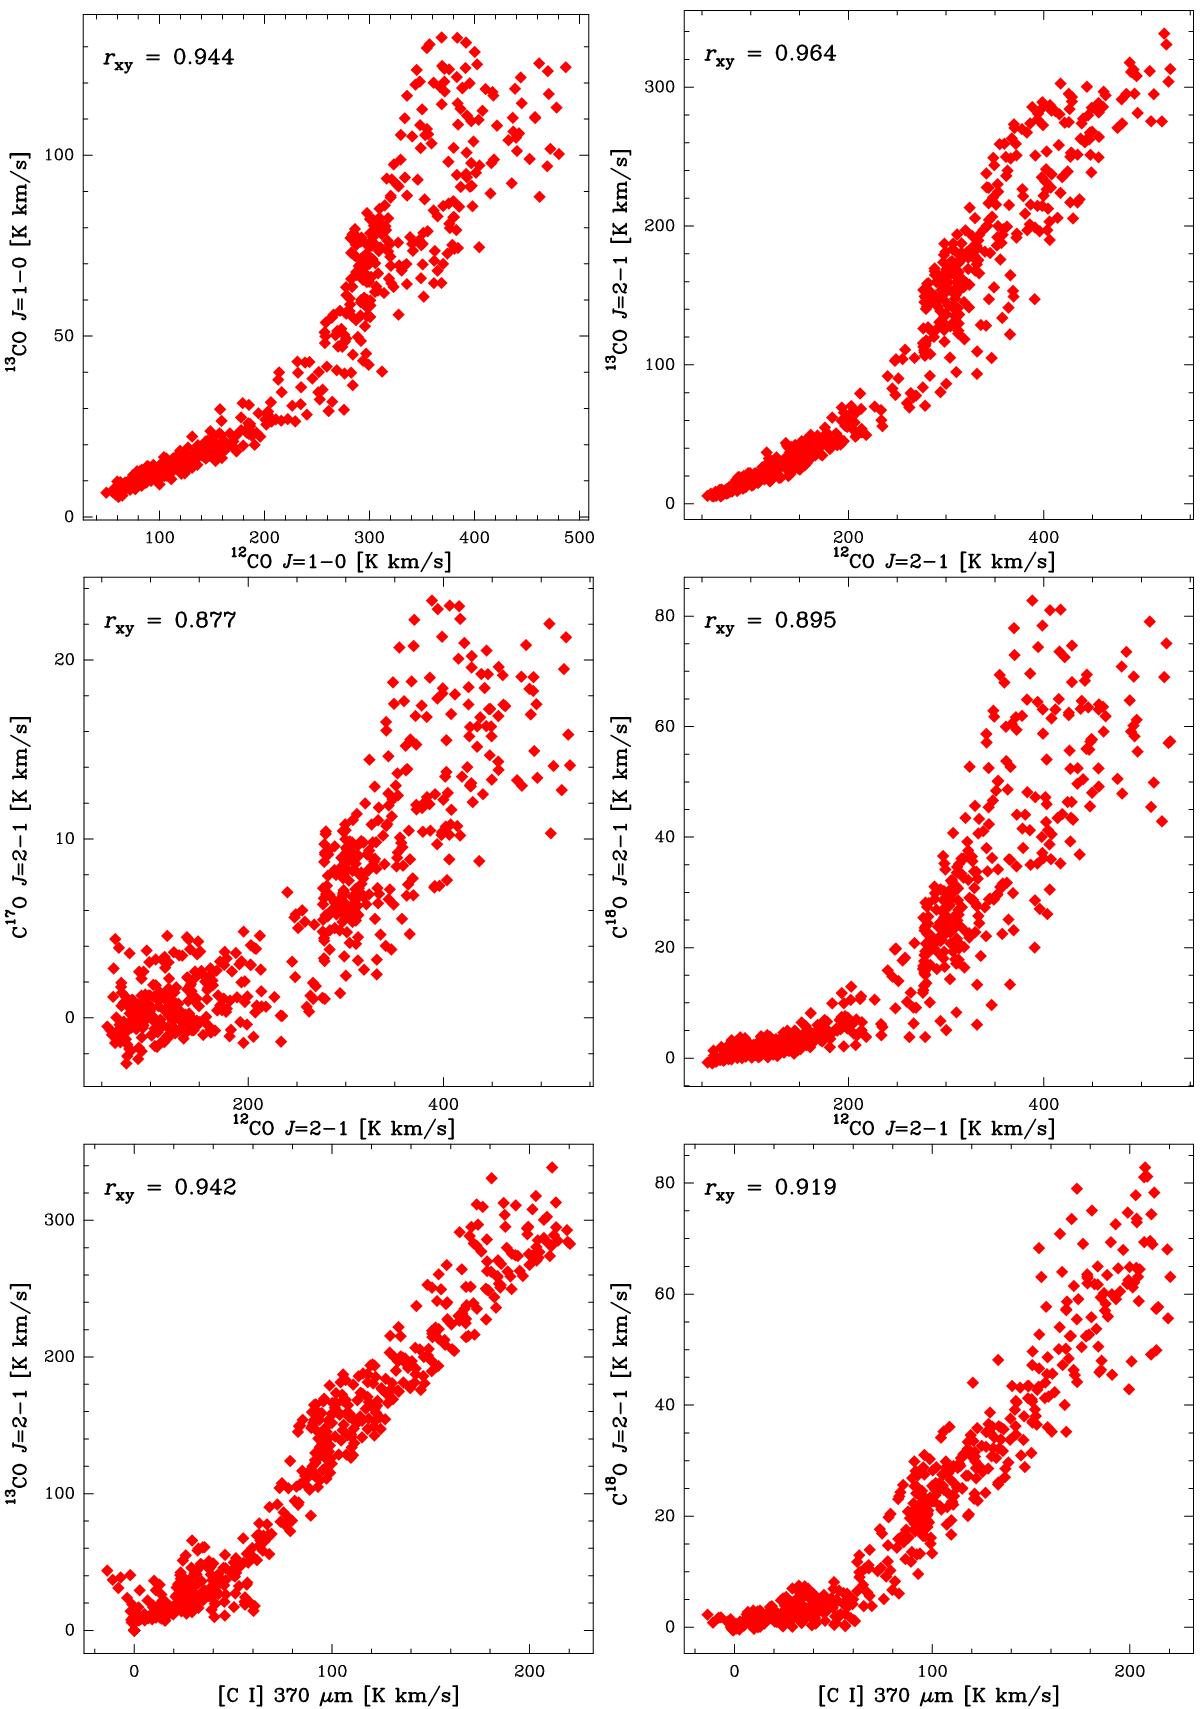
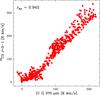
Scatter plots and correlation coefficients rxy (from Eq. (C.1)) between the velocity-integrated intensity of 12CO and 13CO J = 1 → 0 (top-left), and the 12CO J = 2 → 1 compared to the J = 2 → 1 lines of 13CO (top-right), C![]() O (middle-left), and C
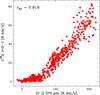
O (middle-left), and C![]() O (middle-right). The bottom panel shows the scatter plot and correlation coefficient between the [C I] 370 μm and the J = 2 → 1 transitions of 13CO (bottom-left) and C
O (middle-right). The bottom panel shows the scatter plot and correlation coefficient between the [C I] 370 μm and the J = 2 → 1 transitions of 13CO (bottom-left) and C![]() O (bottom-right).
O (bottom-right).
Current usage metrics show cumulative count of Article Views (full-text article views including HTML views, PDF and ePub downloads, according to the available data) and Abstracts Views on Vision4Press platform.
Data correspond to usage on the plateform after 2015. The current usage metrics is available 48-96 hours after online publication and is updated daily on week days.
Initial download of the metrics may take a while.