Free Access
Fig. E.1
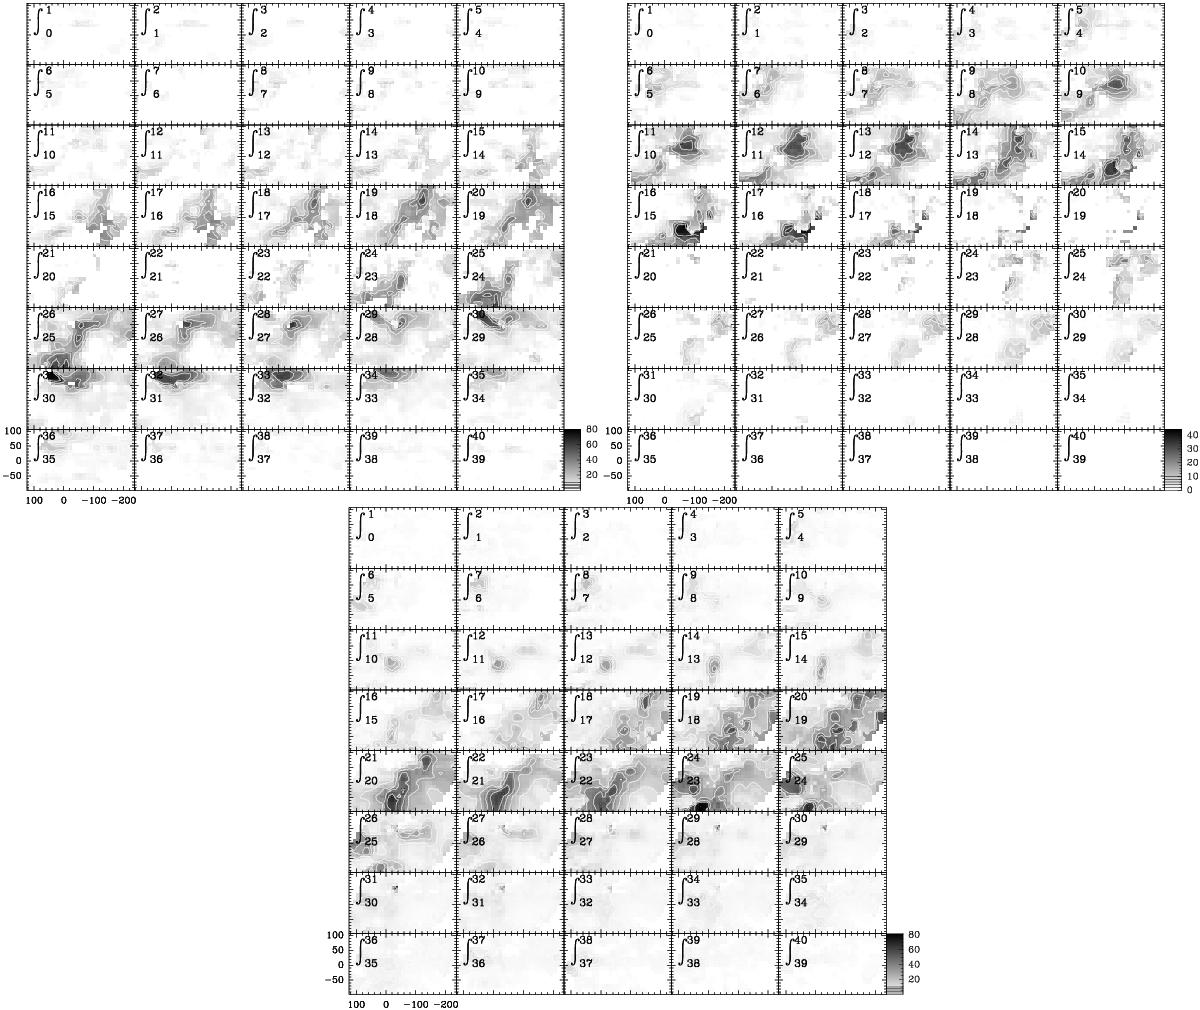
Velocity channel maps at 1 km s-1 width of the [C II] emission (in K km s-1 ), associated with the H II (top left), H I (top right), and H2 (bottom) gas phase, as estimated with model (2) from Table 1. Contours are 20%, 40%, 60%, 80%, and 100% of the respective peak emissions
This figure is made of several images, please see below:
Current usage metrics show cumulative count of Article Views (full-text article views including HTML views, PDF and ePub downloads, according to the available data) and Abstracts Views on Vision4Press platform.
Data correspond to usage on the plateform after 2015. The current usage metrics is available 48-96 hours after online publication and is updated daily on week days.
Initial download of the metrics may take a while.