Fig. D.1
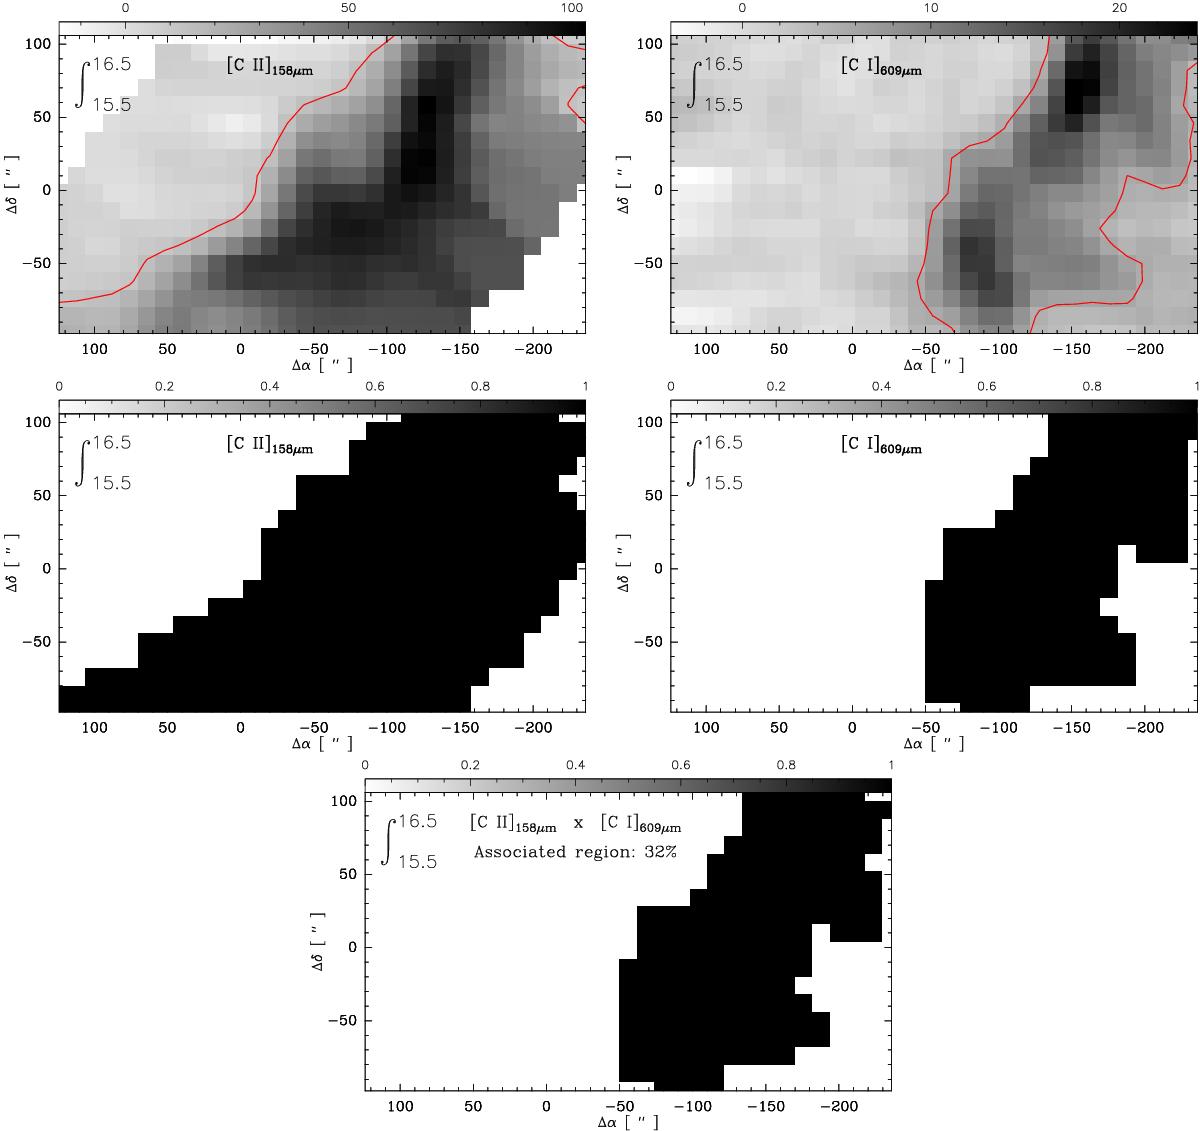
Example of the steps in the method to estimate the spatial association between two emission lines. The top panels shows the channel maps of the 1 km s-1 integrated intensity (in K km s-1 ) of the [C II] 158 μm (left) and [C I] 609 μm (right) lines. The contour lines correspond to the threshold of 10% of their global peak intensities (136.4 K km s-1 and 54.6 K km s-1 for [C II] and [C I], respectively). The middle panels are the binary images obtained after applying the intensity threshold to the original channel maps. The bottom panel shows the result of multiplying the two binary images, which corresponds to the region where the emission of both [C II] and [C I] lines are associated in a particular velocity channel (in this case 15.5–16.5 km s-1).
Current usage metrics show cumulative count of Article Views (full-text article views including HTML views, PDF and ePub downloads, according to the available data) and Abstracts Views on Vision4Press platform.
Data correspond to usage on the plateform after 2015. The current usage metrics is available 48-96 hours after online publication and is updated daily on week days.
Initial download of the metrics may take a while.