Fig. 3
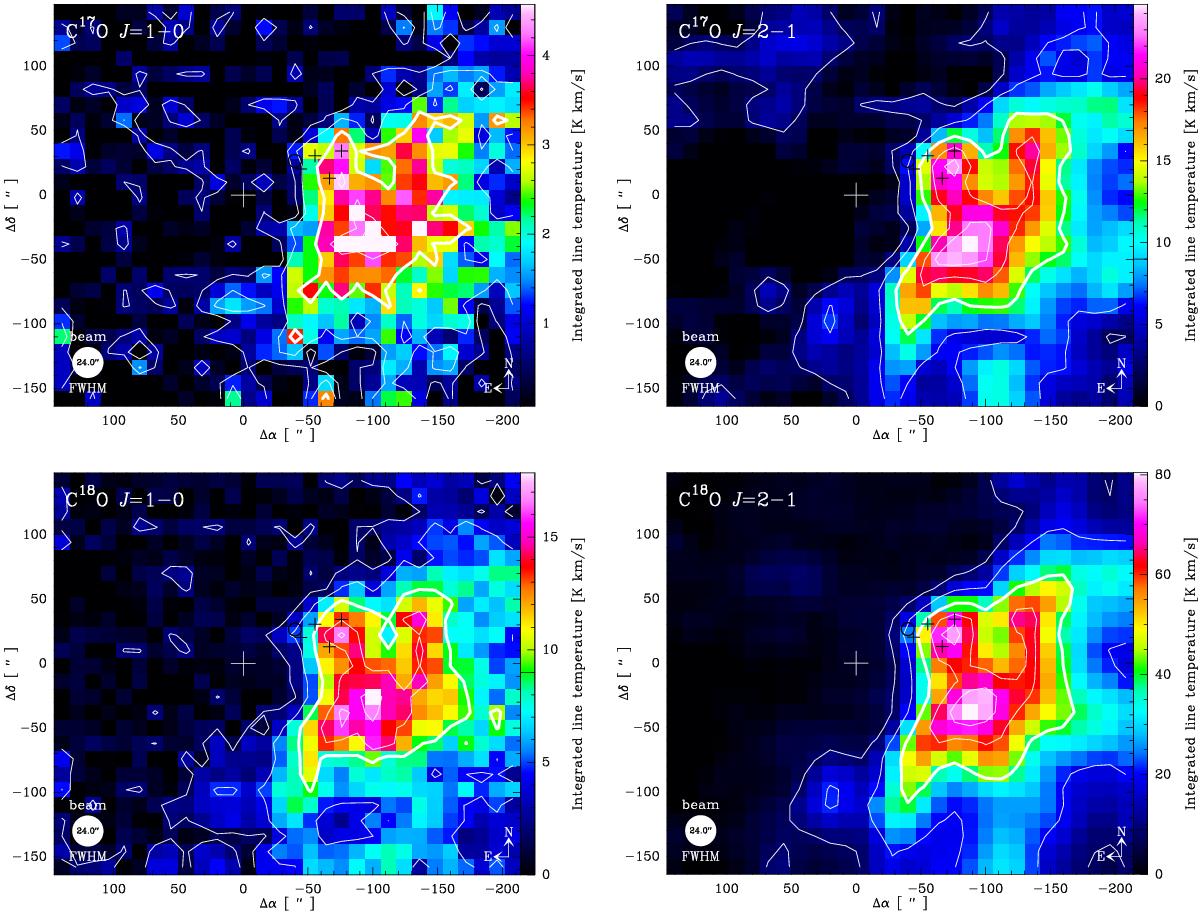
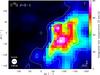
Color maps of the velocity integrated intensity (in the range 0–40 km s-1) of the J = 1 → 0 and J = 2 → 1 transitions of C![]() O (top panels) and C
O (top panels) and C![]() O (bottom panels) in M17 SW. Only the C
O (bottom panels) in M17 SW. Only the C![]() O J = 1 → 0 line was integrated between 14 and 28 km s-1 because it is fainter and noisier than the other lines. The contour levels are 25%, 50% (thick contour), 75%, and 90% of the peak emission. All maps have been convolved to the larger beam (24′′) of the C
O J = 1 → 0 line was integrated between 14 and 28 km s-1 because it is fainter and noisier than the other lines. The contour levels are 25%, 50% (thick contour), 75%, and 90% of the peak emission. All maps have been convolved to the larger beam (24′′) of the C![]() O J = 1 → 0 line. The reference position (Δα = 0, Δδ = 0) and symbols are as in Fig. 2.
O J = 1 → 0 line. The reference position (Δα = 0, Δδ = 0) and symbols are as in Fig. 2.
Current usage metrics show cumulative count of Article Views (full-text article views including HTML views, PDF and ePub downloads, according to the available data) and Abstracts Views on Vision4Press platform.
Data correspond to usage on the plateform after 2015. The current usage metrics is available 48-96 hours after online publication and is updated daily on week days.
Initial download of the metrics may take a while.