Fig. B.1
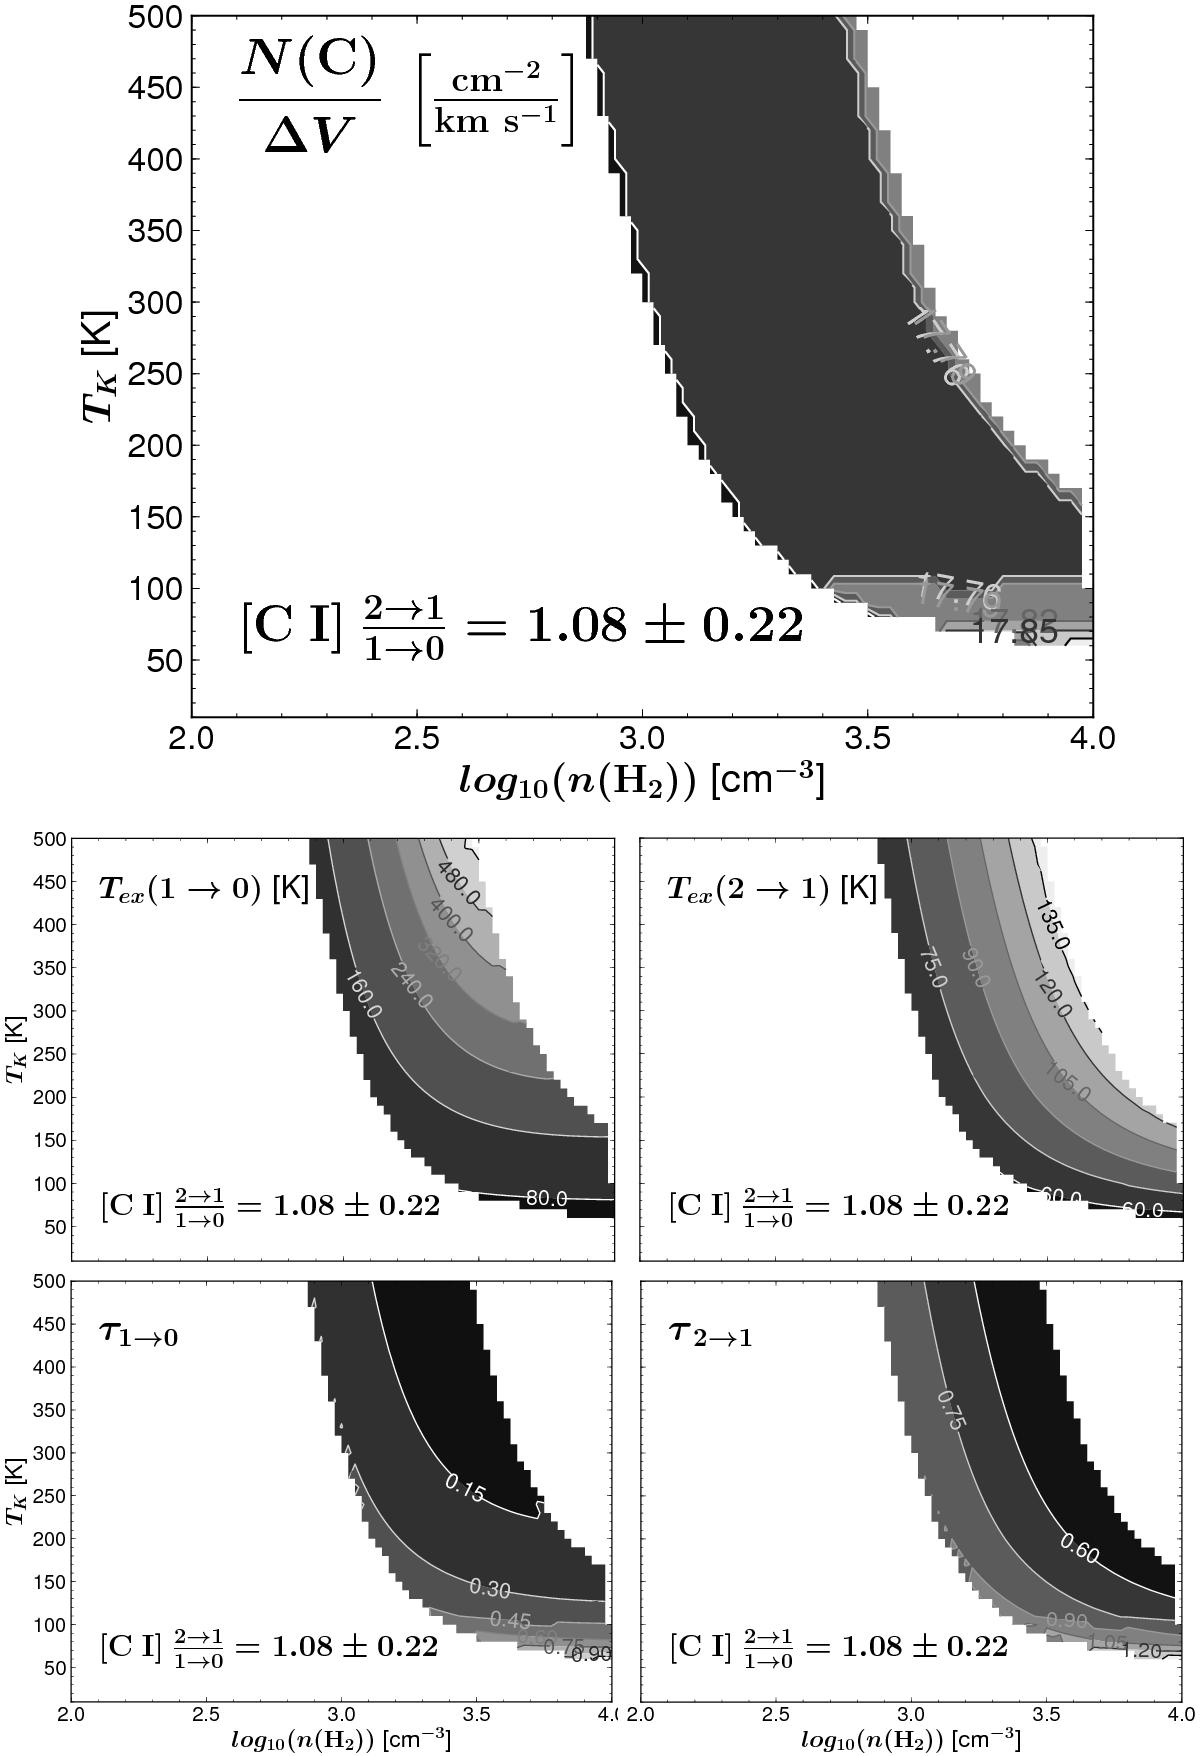
Excitation map (top panel) for the [C I] ![]() line ratio observed at offset position (−130′′,−10′′) in the velocity channel 19–20 km s-1. The contours and labels correspond to the column density per line width N/ ΔV (cm-2 km-1 s, in log10 scale). In the middle panel the contours and labels correspond to the excitation temperature Tex (K) of the J = 1 → 0 (left) and J = 2 → 1 (right) transitions, while the bottom panel shows the corresponding optical depths for each line.
line ratio observed at offset position (−130′′,−10′′) in the velocity channel 19–20 km s-1. The contours and labels correspond to the column density per line width N/ ΔV (cm-2 km-1 s, in log10 scale). In the middle panel the contours and labels correspond to the excitation temperature Tex (K) of the J = 1 → 0 (left) and J = 2 → 1 (right) transitions, while the bottom panel shows the corresponding optical depths for each line.
Current usage metrics show cumulative count of Article Views (full-text article views including HTML views, PDF and ePub downloads, according to the available data) and Abstracts Views on Vision4Press platform.
Data correspond to usage on the plateform after 2015. The current usage metrics is available 48-96 hours after online publication and is updated daily on week days.
Initial download of the metrics may take a while.