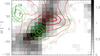
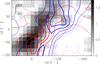
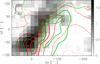
Fig. 22
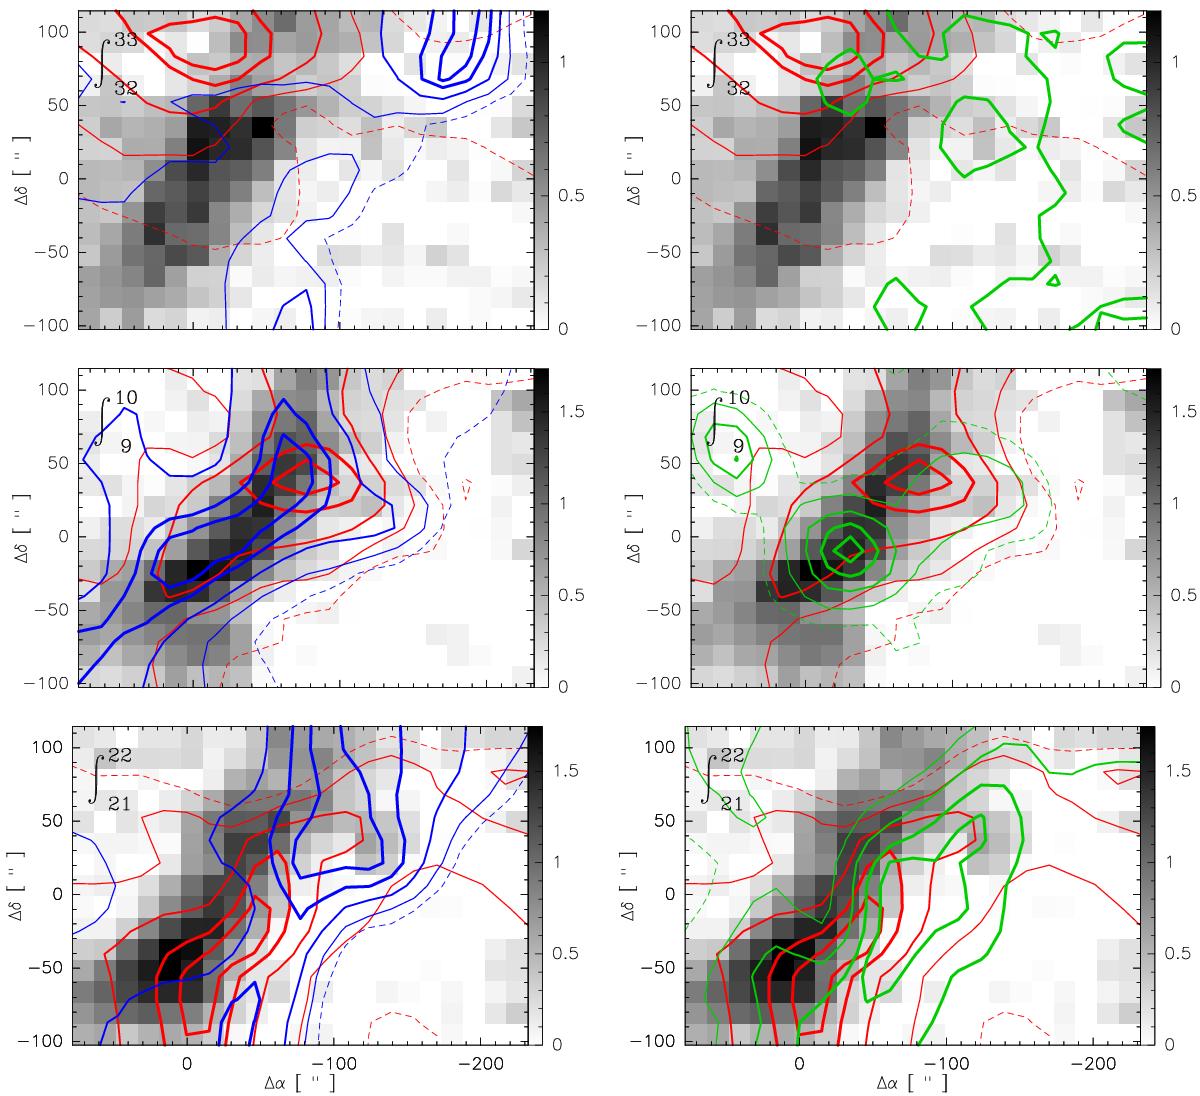
Channel maps of the H41α line (gray background, in K km s-1 ) with overlays of the [C II] (red contours), the τ(H I) optical depth (blue contours) (left panels), and the 12CO J = 1 → 0 (green contours) (right panels), at the velocity ranges of the peak [C II] emission associated with (from top to bottom) the H II, H I, and H2 gas regimes. The corresponding velocity ranges are shown in the top-left of each channel map. The contour lines (from thin to thick) are 10% (dashed line), 25%, 50%, 75%, and 90% of the respective peak emissions. All the maps were convolved with a 30′′ beam to increase the S/N of the H41α map.
Current usage metrics show cumulative count of Article Views (full-text article views including HTML views, PDF and ePub downloads, according to the available data) and Abstracts Views on Vision4Press platform.
Data correspond to usage on the plateform after 2015. The current usage metrics is available 48-96 hours after online publication and is updated daily on week days.
Initial download of the metrics may take a while.