Fig. 20
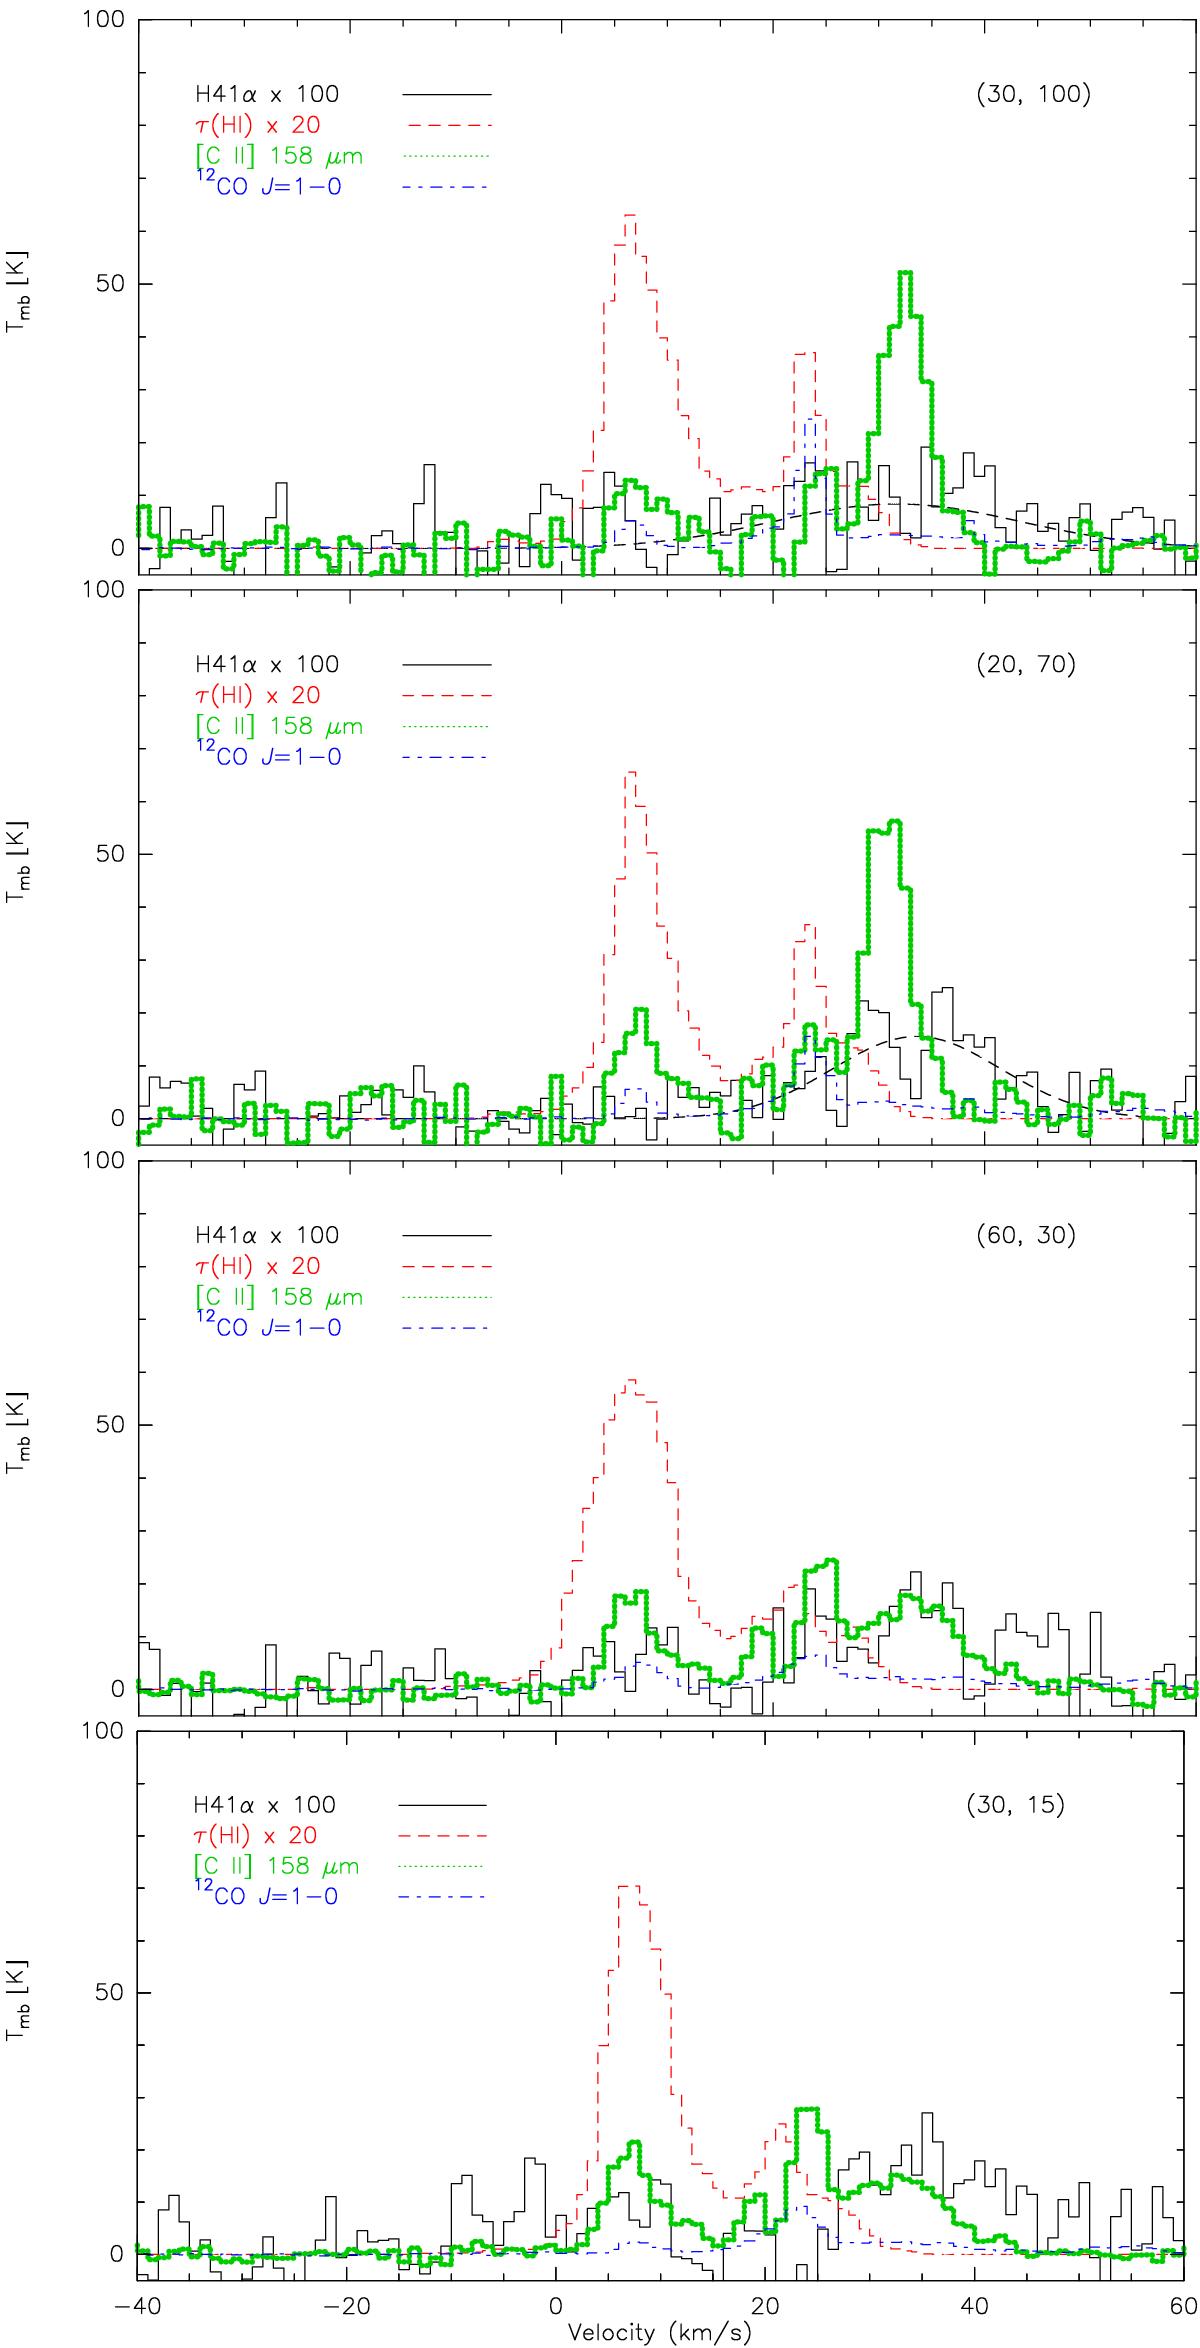
Spectra of several lines observed at approximated (±3′′) offset positions along the strip line at PA 63° (Δδ = Δα/ 2) and at positions close to the ionizing stars. All the spectra have been resampled to a 1 km s-1 resolution and convolved with a 30′′ beam, to increase the S/N of the H41α map. A Gaussian was fit to the H41α line at the top two positions.
Current usage metrics show cumulative count of Article Views (full-text article views including HTML views, PDF and ePub downloads, according to the available data) and Abstracts Views on Vision4Press platform.
Data correspond to usage on the plateform after 2015. The current usage metrics is available 48-96 hours after online publication and is updated daily on week days.
Initial download of the metrics may take a while.