Fig. 19
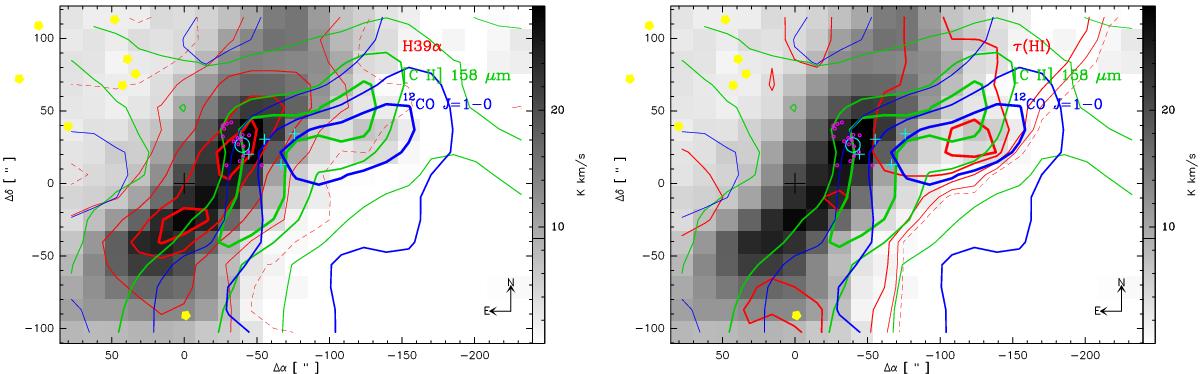
Left: velocity-integrated intensity maps of H41α (gray), H39α (red contour), [C II] 158 μm (green contour), and 12CO J = 1 → 0 (blue contour). The contour lines (from thin to thick) are 10% (dashed line), 25%, 50%, 75%, and 90% of the respective peak emissions. The stars indicate the O and B ionizing stars (Beetz et al. 1976; Hanson et al. 1997). The reference position (Δα = 0, Δδ = 0), marked with a cross, is as in Fig. 2. The ultracompact H II region M17-UC1 and four H2O masers (Johnson et al. 1998) are marked by the circle and “+” symbols, respectively. The small purple circles correspond to the heavily obscured (Emedian> 2.5 keV, AV ≥ 10 mag) population of X-ray sources around the M17-UC1 region (Fig. 10 in Broos et al. 2007; coordinates from the VizieR catalog). Right: same as on the left, but with τ(H I) instead of H39α. All maps have been convolved with a 30′′ beam, to increase the S/N of the H41α map.
Current usage metrics show cumulative count of Article Views (full-text article views including HTML views, PDF and ePub downloads, according to the available data) and Abstracts Views on Vision4Press platform.
Data correspond to usage on the plateform after 2015. The current usage metrics is available 48-96 hours after online publication and is updated daily on week days.
Initial download of the metrics may take a while.