Fig. 17
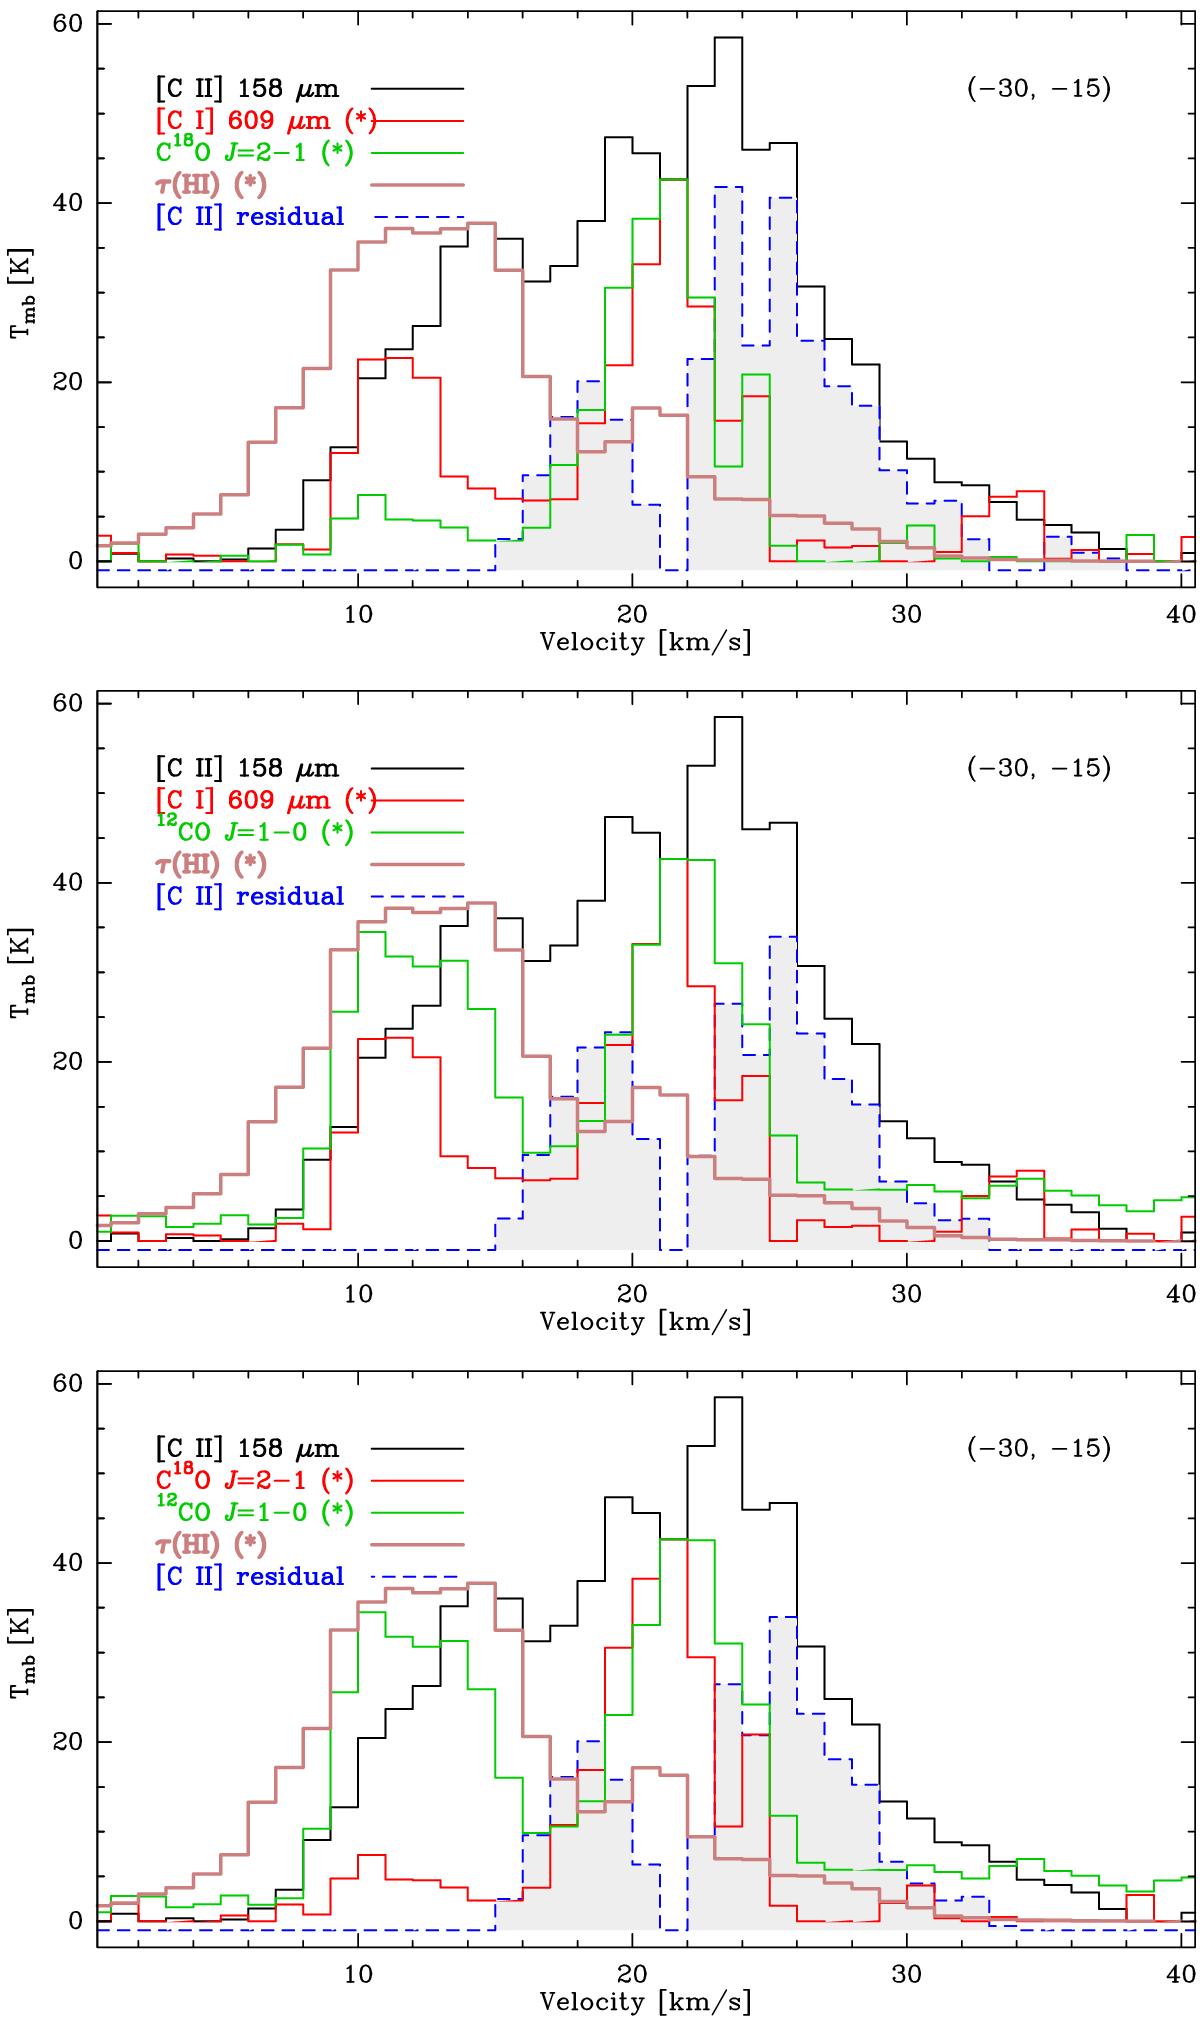
Residual [C II] 158 μm spectrum (dashed line and gray filled histogram) at offset position (–30′′, –15′′), after subtracting, from the original [C II] spectrum, the scaled up (*) spectra of model 1-(top), 2-(middle) and 3-(bottom), as well as the optical depth of H I, τ(H I) (see text). All negative (noise) channels in the scaled up and residual spectra are set to zero. The residual [C II] spectrum is shifted in −1 K for clarity.
Current usage metrics show cumulative count of Article Views (full-text article views including HTML views, PDF and ePub downloads, according to the available data) and Abstracts Views on Vision4Press platform.
Data correspond to usage on the plateform after 2015. The current usage metrics is available 48-96 hours after online publication and is updated daily on week days.
Initial download of the metrics may take a while.