Free Access
Fig. 11
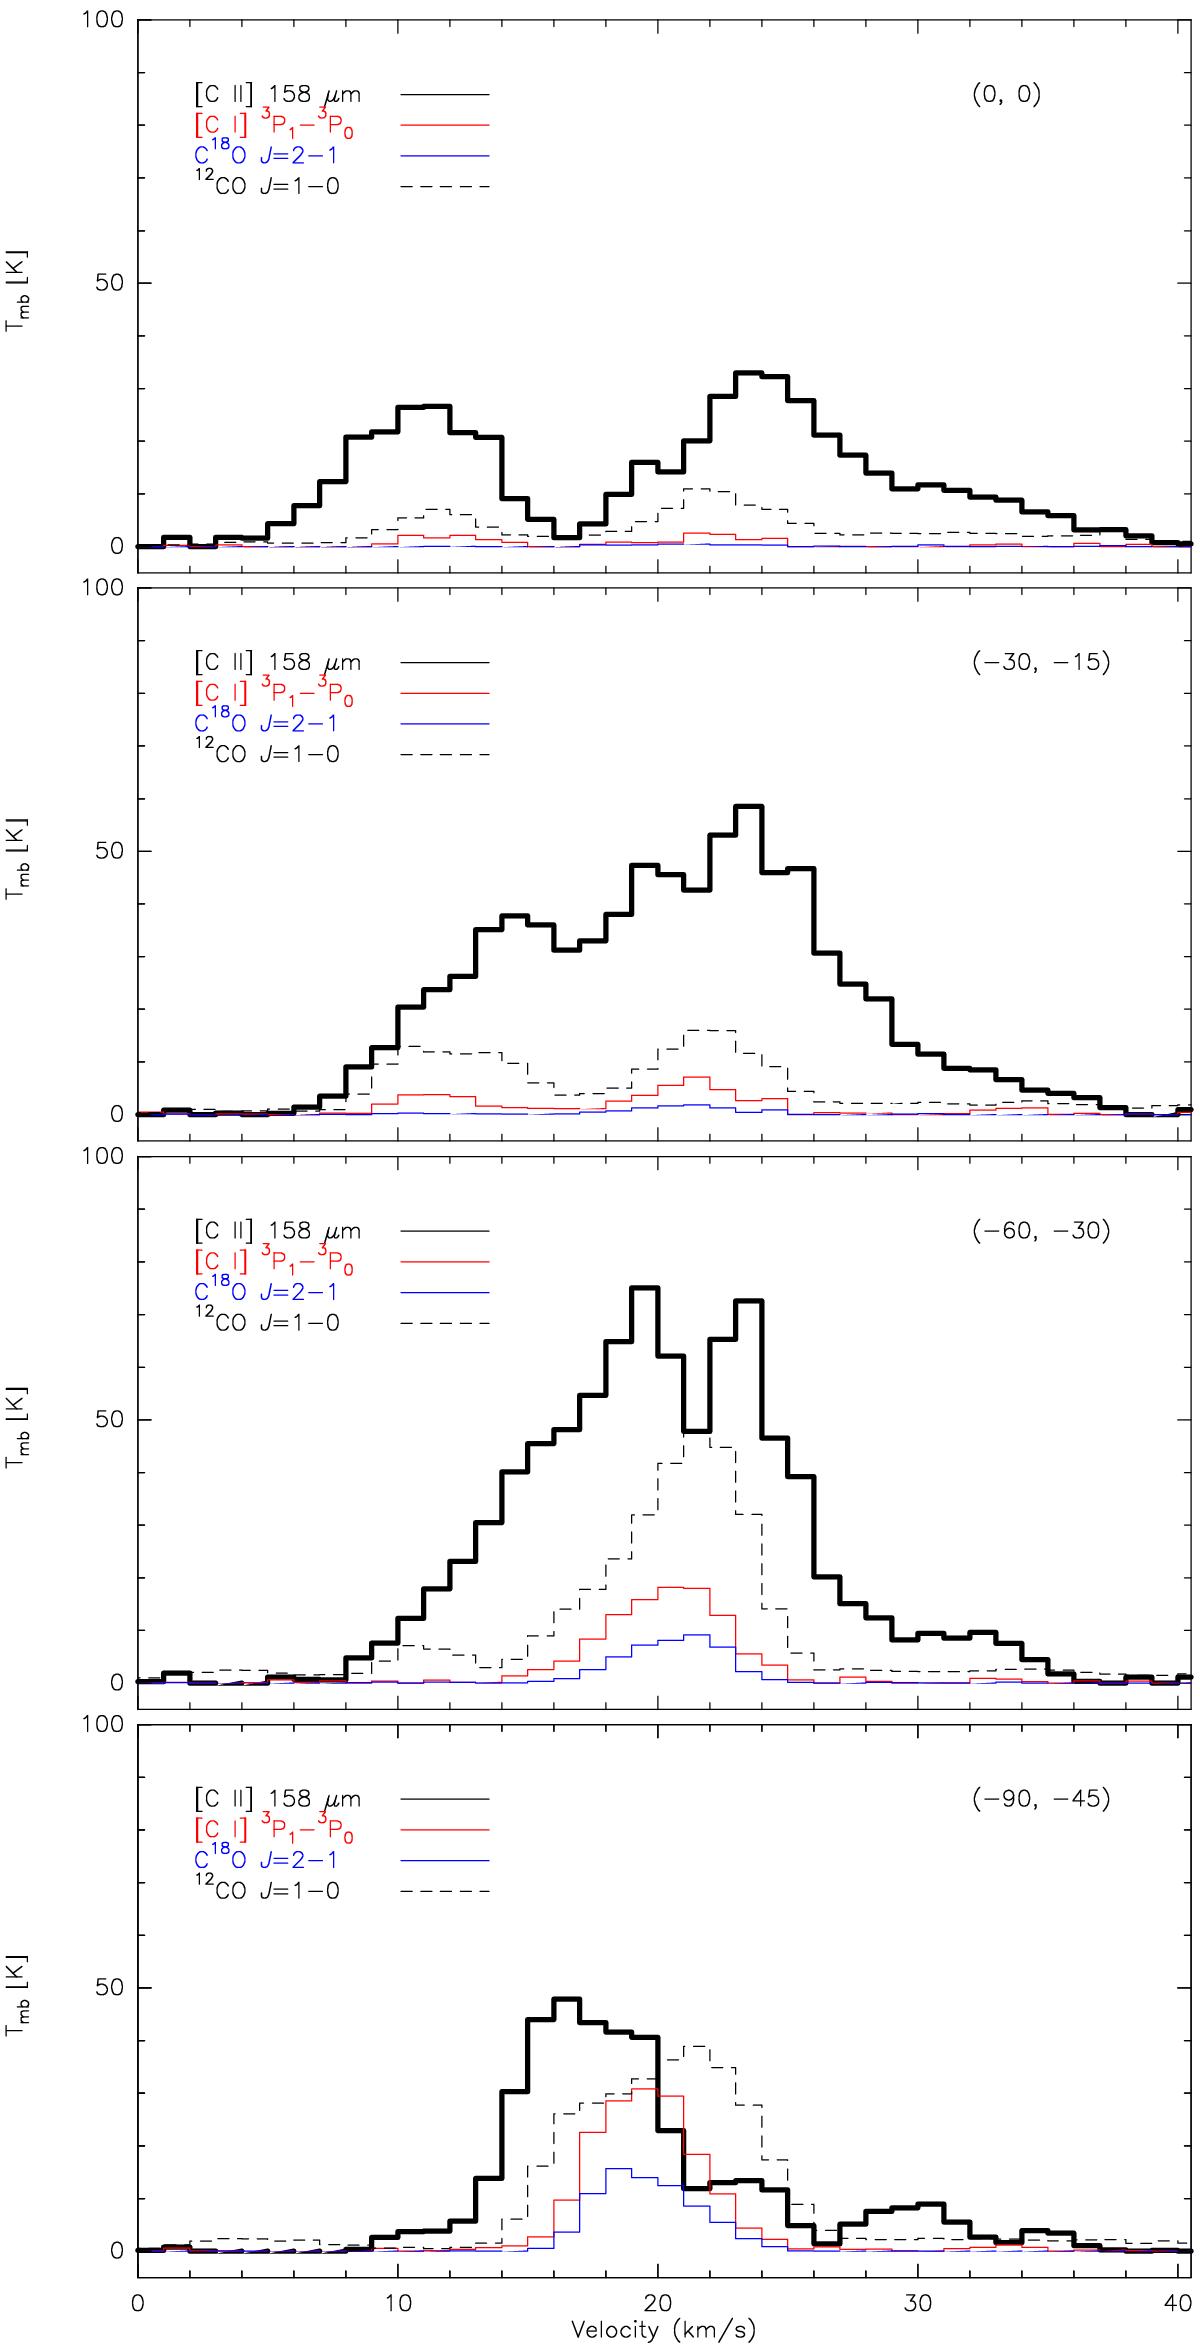
Spectra of several lines observed at approximated (±2′′) offset positions along the strip line at PA 63° (Δδ = Δα/ 2). All the spectra have been resampled to a 1 km s-1 resolution and convolved with the largest beam of 24′′, corresponding to the C![]() O J = 1 → 0 map.
O J = 1 → 0 map.
This figure is made of several images, please see below:
Current usage metrics show cumulative count of Article Views (full-text article views including HTML views, PDF and ePub downloads, according to the available data) and Abstracts Views on Vision4Press platform.
Data correspond to usage on the plateform after 2015. The current usage metrics is available 48-96 hours after online publication and is updated daily on week days.
Initial download of the metrics may take a while.