Fig. 1
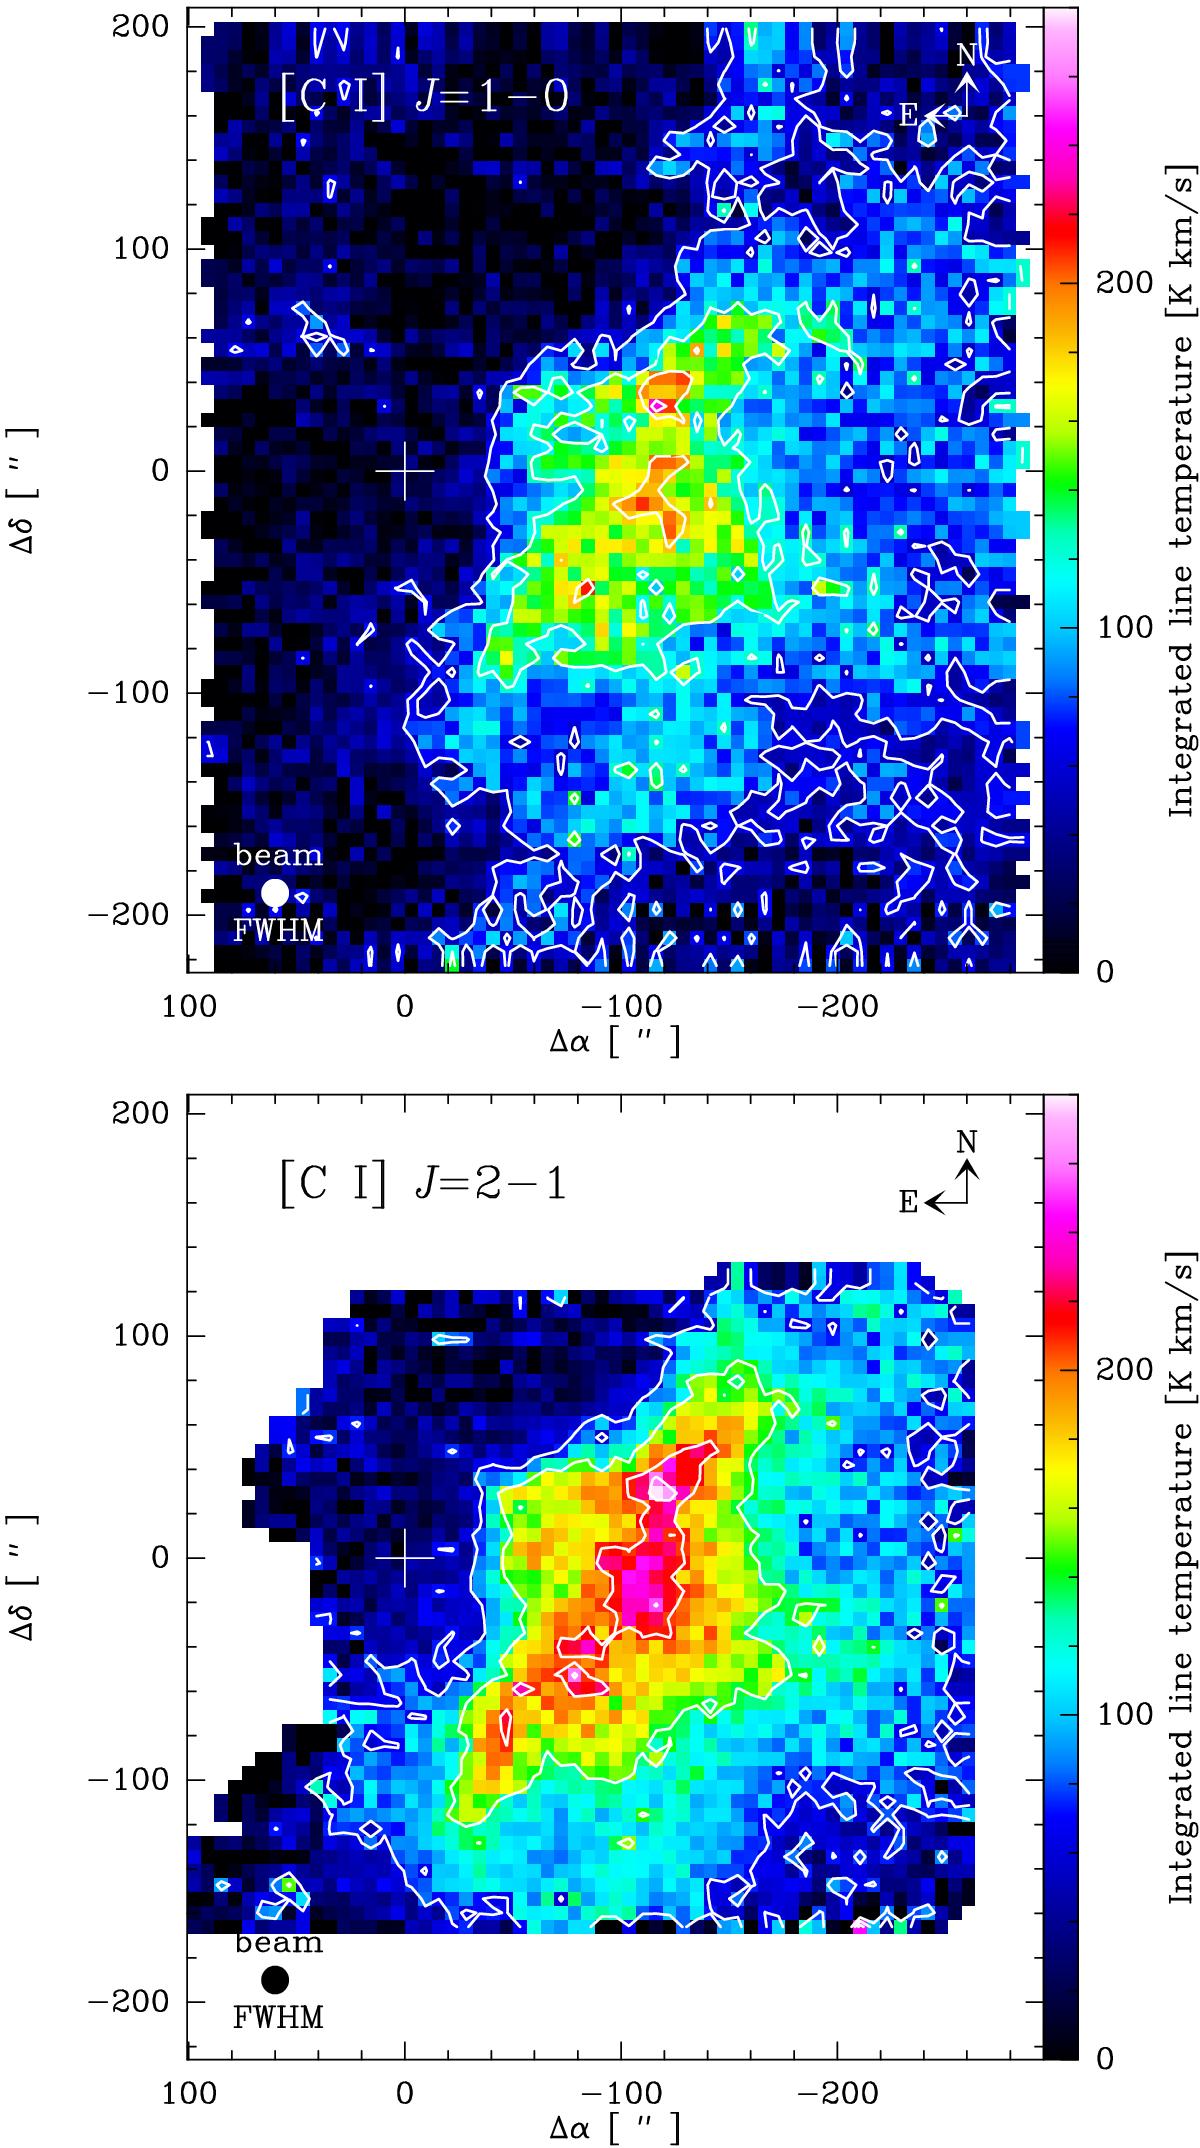
Top: color map of the velocity integrated (in the range 0–40 km s-1) intensity of [C I] J = 1 → 0 in M17 SW. The peak emission is 240 K km s-1. The contour levels are 25%, 50%, 75%, and 90% of the peak emission. Bottom: color map of the integrated intensity of [C I] J = 2 → 1 (from Pérez-Beaupuits et al. 2010) convolved to the beam size (![]() ) of the [C I] J = 1 → 0 line, with a peak emission of 280 K km s-1 . The contour levels are as described above. The reference position (Δα = 0, Δδ = 0) is as in Fig. 2.
) of the [C I] J = 1 → 0 line, with a peak emission of 280 K km s-1 . The contour levels are as described above. The reference position (Δα = 0, Δδ = 0) is as in Fig. 2.
Current usage metrics show cumulative count of Article Views (full-text article views including HTML views, PDF and ePub downloads, according to the available data) and Abstracts Views on Vision4Press platform.
Data correspond to usage on the plateform after 2015. The current usage metrics is available 48-96 hours after online publication and is updated daily on week days.
Initial download of the metrics may take a while.