Fig. 9
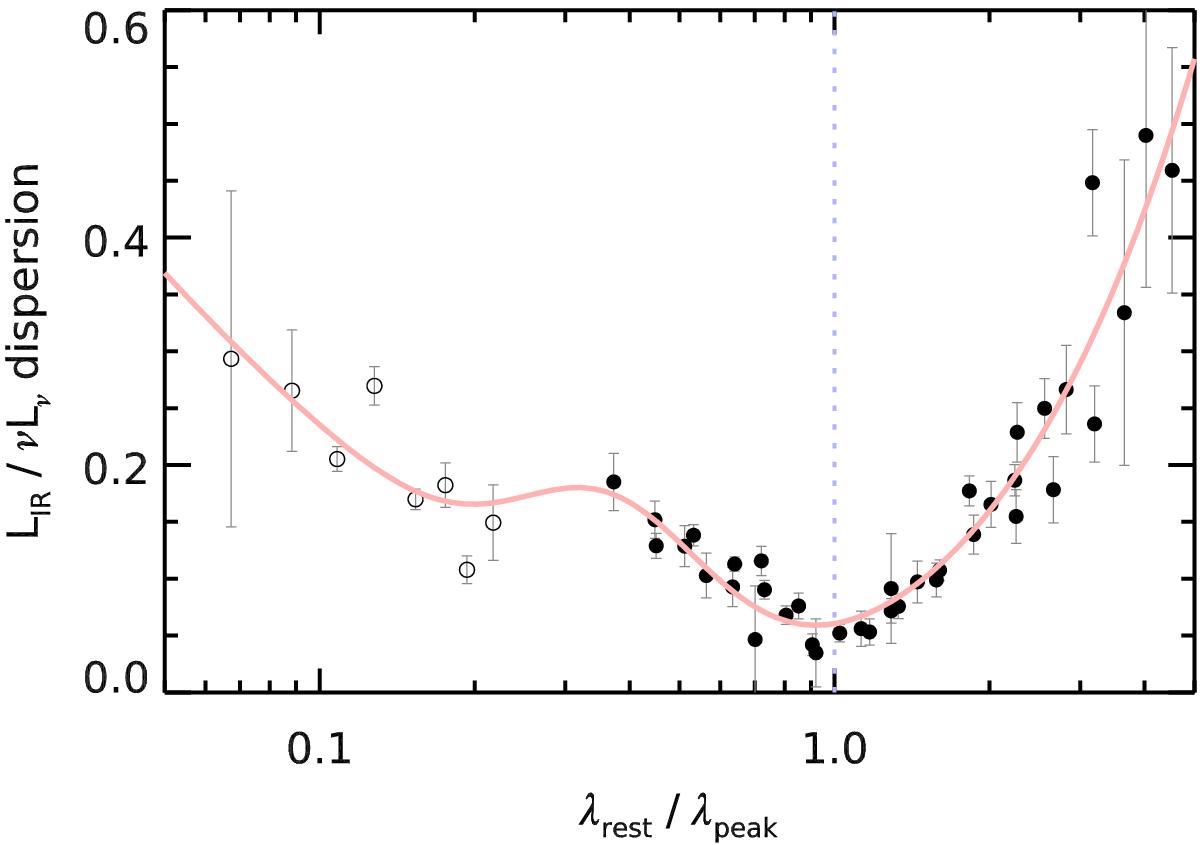
Dispersion of the ratio LIR/νLν as a function of wavelength in bins of redshift and for the five Herschel bands in the four CANDELS fields. The wavelength is normalized here to the “peak” wavelength, where the FIR SED in νLν reaches its maximum (calibrated from our stacked SEDs, Fig. 6). The LIR is computed by fitting all the available Herschel bands (we require a minimum of three) together with CE01 templates, while νLν is the flux in a single Herschel band converted to rest-frame luminosity. Open symbols denote measurements where νLν comes from MIPS 24 μm. Error bars come from simple bootstrapping. The contribution of photometric errors was statistically removed. The red line shows a fit to the data points to guide the eye.
Current usage metrics show cumulative count of Article Views (full-text article views including HTML views, PDF and ePub downloads, according to the available data) and Abstracts Views on Vision4Press platform.
Data correspond to usage on the plateform after 2015. The current usage metrics is available 48-96 hours after online publication and is updated daily on week days.
Initial download of the metrics may take a while.