Fig. 8
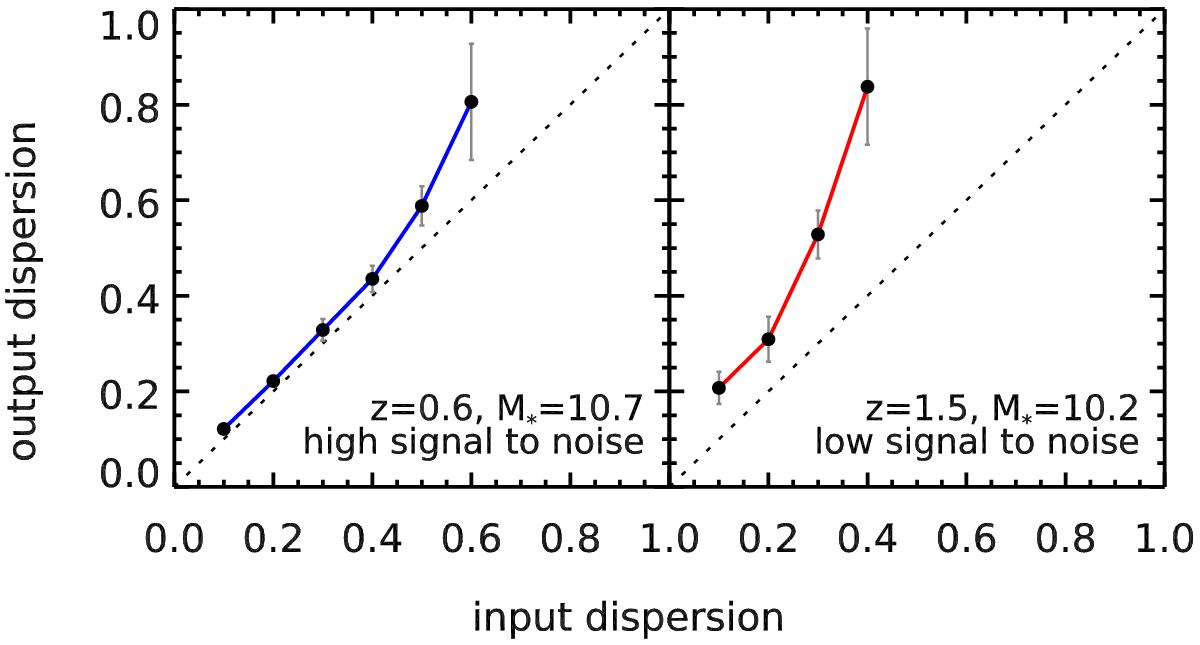
Correction procedure for the measured dispersion. Each point is a simulated dispersion measurement with a different input value. Error bars show the scatter observed among the 20 realizations. The dashed line shows the one-to-one relation. The plots display two examples of simulated dispersions for the PACS 100 μm band, at z = 0.6 for M∗ = 3 × 10¹⁰ (left panel), and at z = 1.5 for M∗ = 2 × 10¹⁰ M⊙ (right panel). These bins were chosen to illustrate the two regimes of high and low S/N, respectively.
Current usage metrics show cumulative count of Article Views (full-text article views including HTML views, PDF and ePub downloads, according to the available data) and Abstracts Views on Vision4Press platform.
Data correspond to usage on the plateform after 2015. The current usage metrics is available 48-96 hours after online publication and is updated daily on week days.
Initial download of the metrics may take a while.