Fig. 6
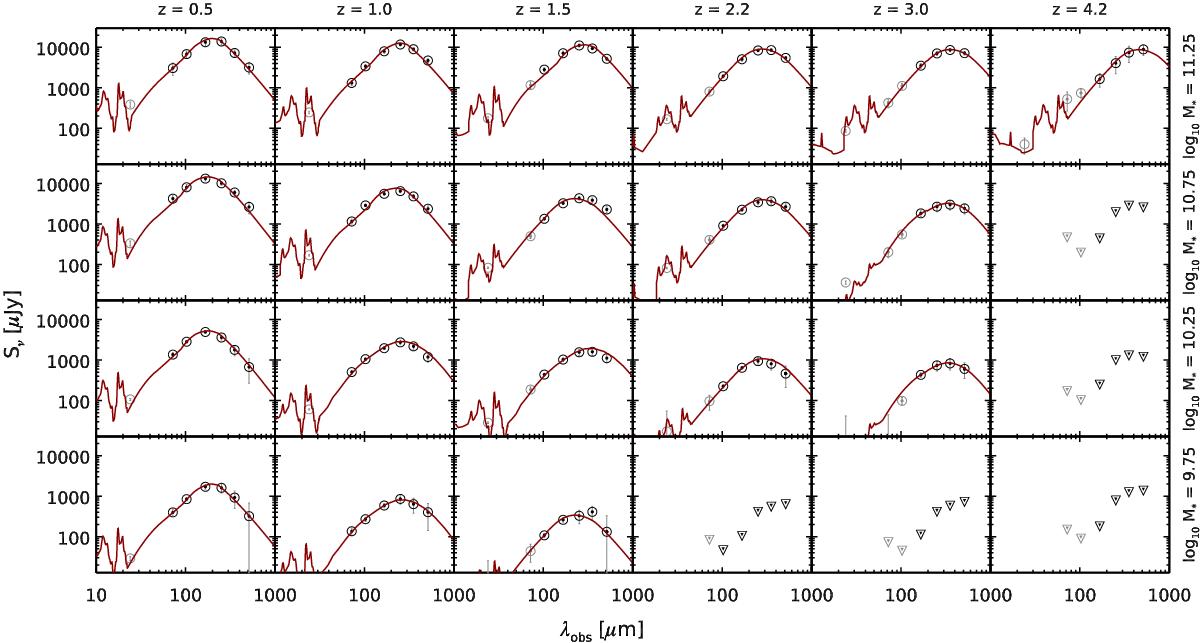
Stacked SEDs of our star-forming mass-selected samples in bins of redshift (horizontally) and stellar mass (vertically). Stacked points are shown as empty circles, and the best-fit CE01 template is shown as the solid red curve. Gray data points were not used in the fit because they are probing rest-frame wavelengths below 30 μm. The data points have been corrected for the contribution of galaxy clustering (see Table B.2). In the bins where the signal is too low (typically <5σ), we plot 3σ upper limits as downward triangles.
Current usage metrics show cumulative count of Article Views (full-text article views including HTML views, PDF and ePub downloads, according to the available data) and Abstracts Views on Vision4Press platform.
Data correspond to usage on the plateform after 2015. The current usage metrics is available 48-96 hours after online publication and is updated daily on week days.
Initial download of the metrics may take a while.