Fig. B.4
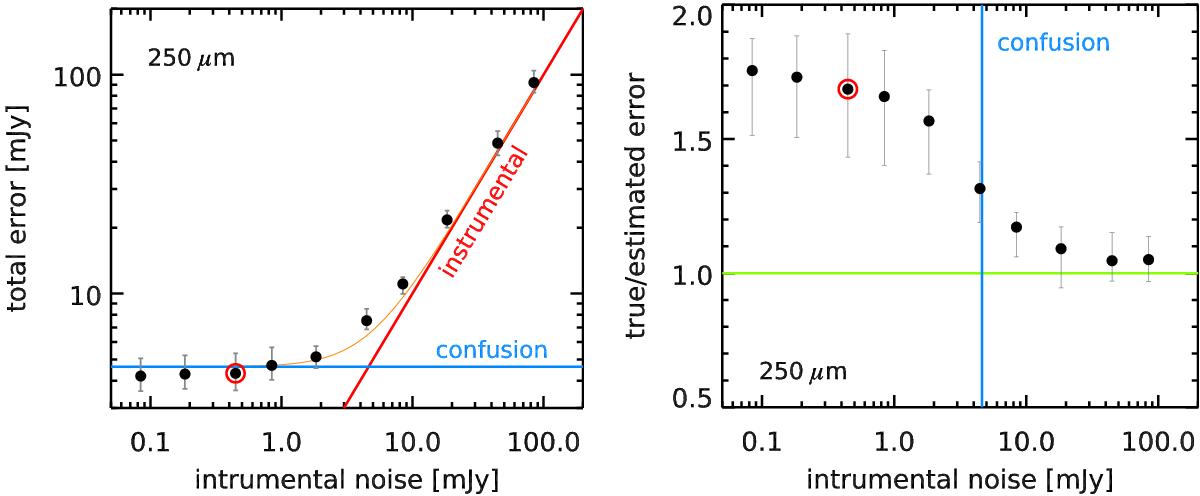
True error σ on the stacked flux measurements as a function of the instrumental white noise level σinst. that is put on the image (here normalized to a “PSF” noise in mJy, i.e., the error on the flux measurement of a point source in the absence of confusion). We generated multiple simulations of the 250 μm maps using varying levels of white noise, and compute σ from the difference between the measured fluxes and their expected values. Left: evolution of the average total noise per source ![]() where Nstack is the number of stacked sources. This is the total error when extracting the flux of a single source on the map. When the instrumental noise (red line) is high, it dominates the error budget over the confusion noise. However, when reaching too low values, the measured total noise is dominated by the confusion noise σconf. (blue line). We fit this evolution as
where Nstack is the number of stacked sources. This is the total error when extracting the flux of a single source on the map. When the instrumental noise (red line) is high, it dominates the error budget over the confusion noise. However, when reaching too low values, the measured total noise is dominated by the confusion noise σconf. (blue line). We fit this evolution as ![]() (orange line) to obtain σconf. = 4.6 mJy. The red circle marks the instrumental noise level reached in the real maps. Right: comparison between the estimated error from the stack residual σIMG and the true error σ. The points show the median of σ/σIMG, and the error bars are showing the 16th and 84th percentiles of the distribution. The green horizontal line is the line of perfect agreement, and the blue vertical line marks the confusion noise at 250 μm. The red circle marks the instrumental noise level reached in the real maps.
(orange line) to obtain σconf. = 4.6 mJy. The red circle marks the instrumental noise level reached in the real maps. Right: comparison between the estimated error from the stack residual σIMG and the true error σ. The points show the median of σ/σIMG, and the error bars are showing the 16th and 84th percentiles of the distribution. The green horizontal line is the line of perfect agreement, and the blue vertical line marks the confusion noise at 250 μm. The red circle marks the instrumental noise level reached in the real maps.
Current usage metrics show cumulative count of Article Views (full-text article views including HTML views, PDF and ePub downloads, according to the available data) and Abstracts Views on Vision4Press platform.
Data correspond to usage on the plateform after 2015. The current usage metrics is available 48-96 hours after online publication and is updated daily on week days.
Initial download of the metrics may take a while.