Free Access
Fig. B.1
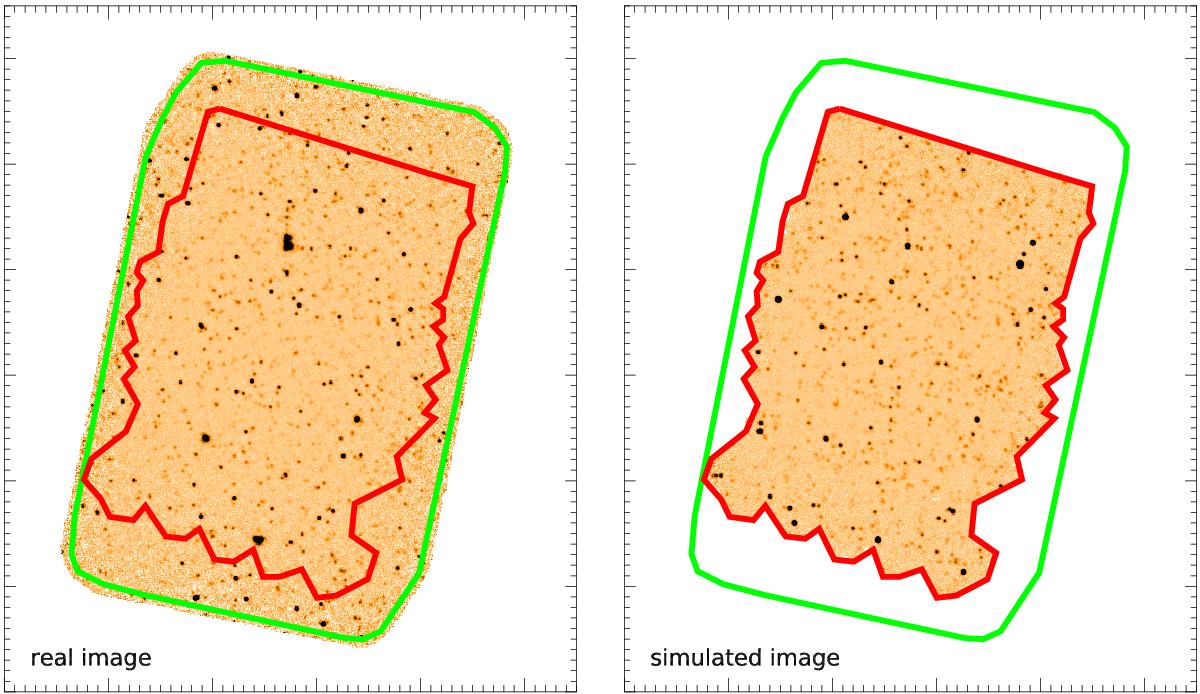
Real Herschel PACS 100 μm image (left) and one of our simulations (right). The green region shows the extent of the PACS coverage, while the red region shows the Hubble ACS coverage, i.e., the extent of our input catalog. The two images are shown here with the same color bar.
Current usage metrics show cumulative count of Article Views (full-text article views including HTML views, PDF and ePub downloads, according to the available data) and Abstracts Views on Vision4Press platform.
Data correspond to usage on the plateform after 2015. The current usage metrics is available 48-96 hours after online publication and is updated daily on week days.
Initial download of the metrics may take a while.