Fig. A.1
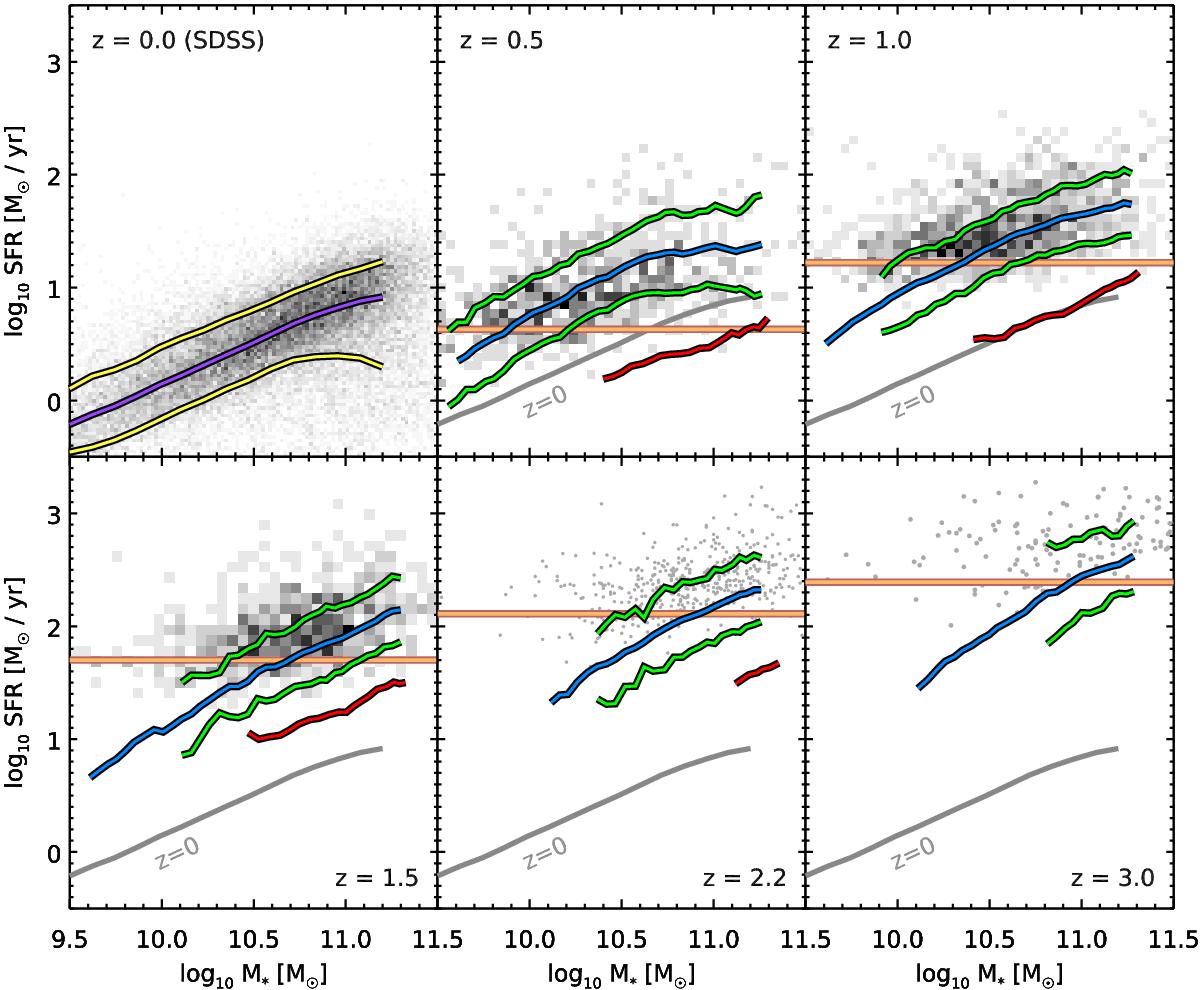
Same as Fig. 16, this time also showing the location of UVJ passive galaxies. In each panel, the blue line shows the average stacked SFR (Sect. 4.2), and the green lines above and below show the 1σ dispersion obtained with scatter stacking. The orange horizontal line shows the detection limit of Herschel in SFR. The red line shows the stacked SFR of UVJ passive galaxies, naively assuming that all the IR light comes from star formation. This is a conservative upper limit, since in these galaxies dust is predominantly heated by old stars, and the effective dust temperature inferred from the FIR SED is much colder than for actively star-forming galaxies of comparable mass.
Current usage metrics show cumulative count of Article Views (full-text article views including HTML views, PDF and ePub downloads, according to the available data) and Abstracts Views on Vision4Press platform.
Data correspond to usage on the plateform after 2015. The current usage metrics is available 48-96 hours after online publication and is updated daily on week days.
Initial download of the metrics may take a while.