Fig. 19
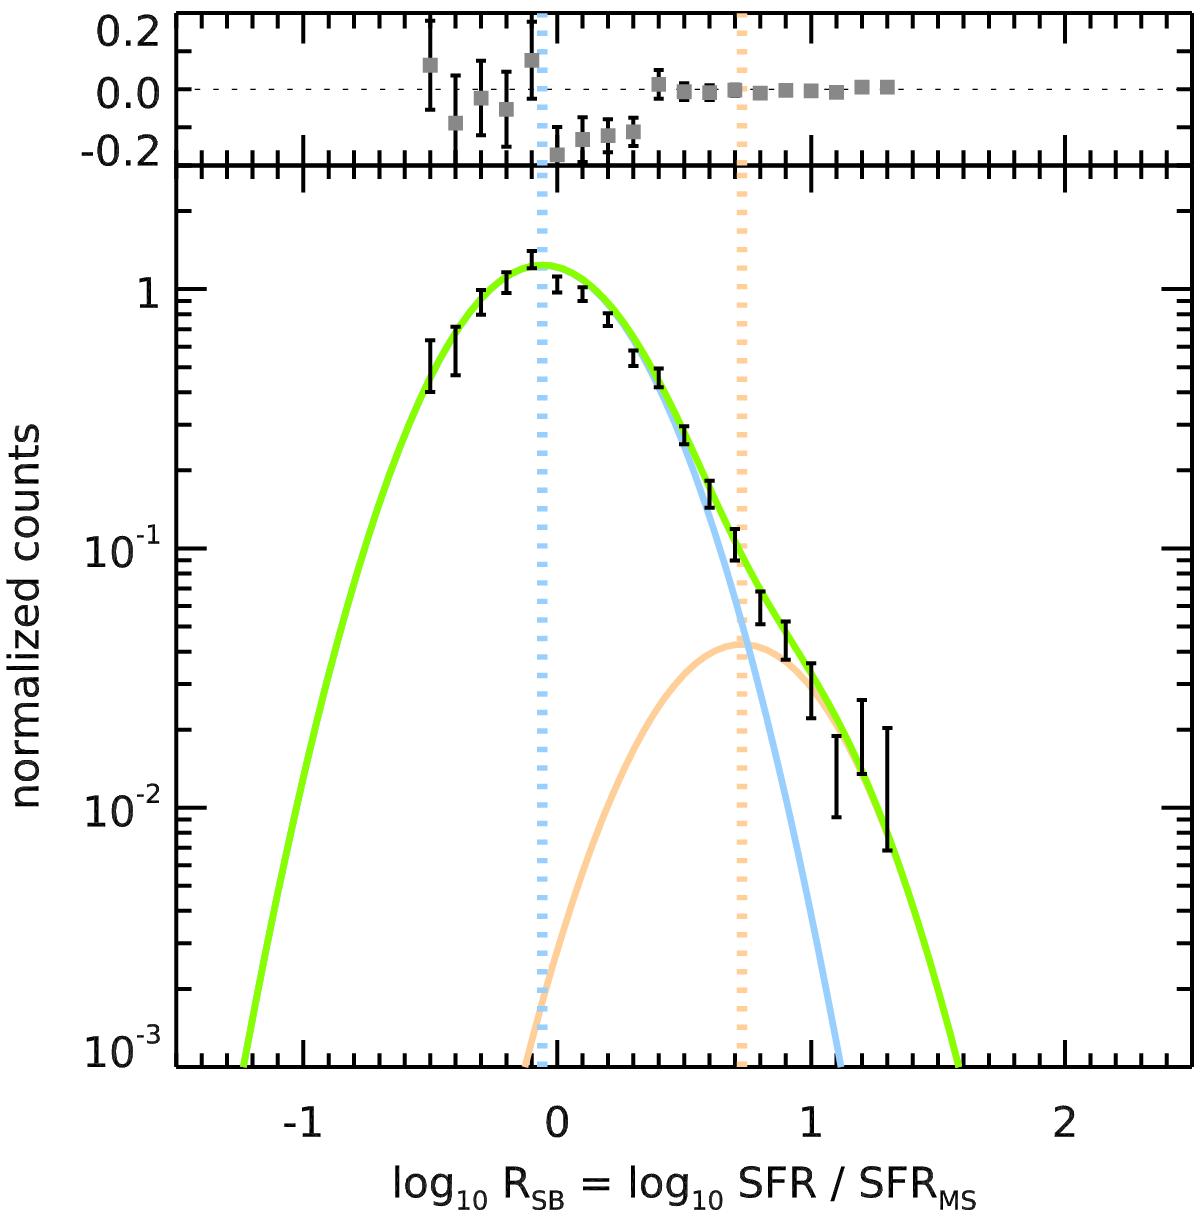
Combined starburstiness (RSB) distributions from Fig. 17 normalized to the total number of star-forming galaxies in each bin. The green line shows our best-fit model from Eq. (10), and the blue and orange lines show the contributions of main sequence and starburst galaxies, respectively. The residuals of the fit are shown at the top of the figure.
Current usage metrics show cumulative count of Article Views (full-text article views including HTML views, PDF and ePub downloads, according to the available data) and Abstracts Views on Vision4Press platform.
Data correspond to usage on the plateform after 2015. The current usage metrics is available 48-96 hours after online publication and is updated daily on week days.
Initial download of the metrics may take a while.