Fig. 17
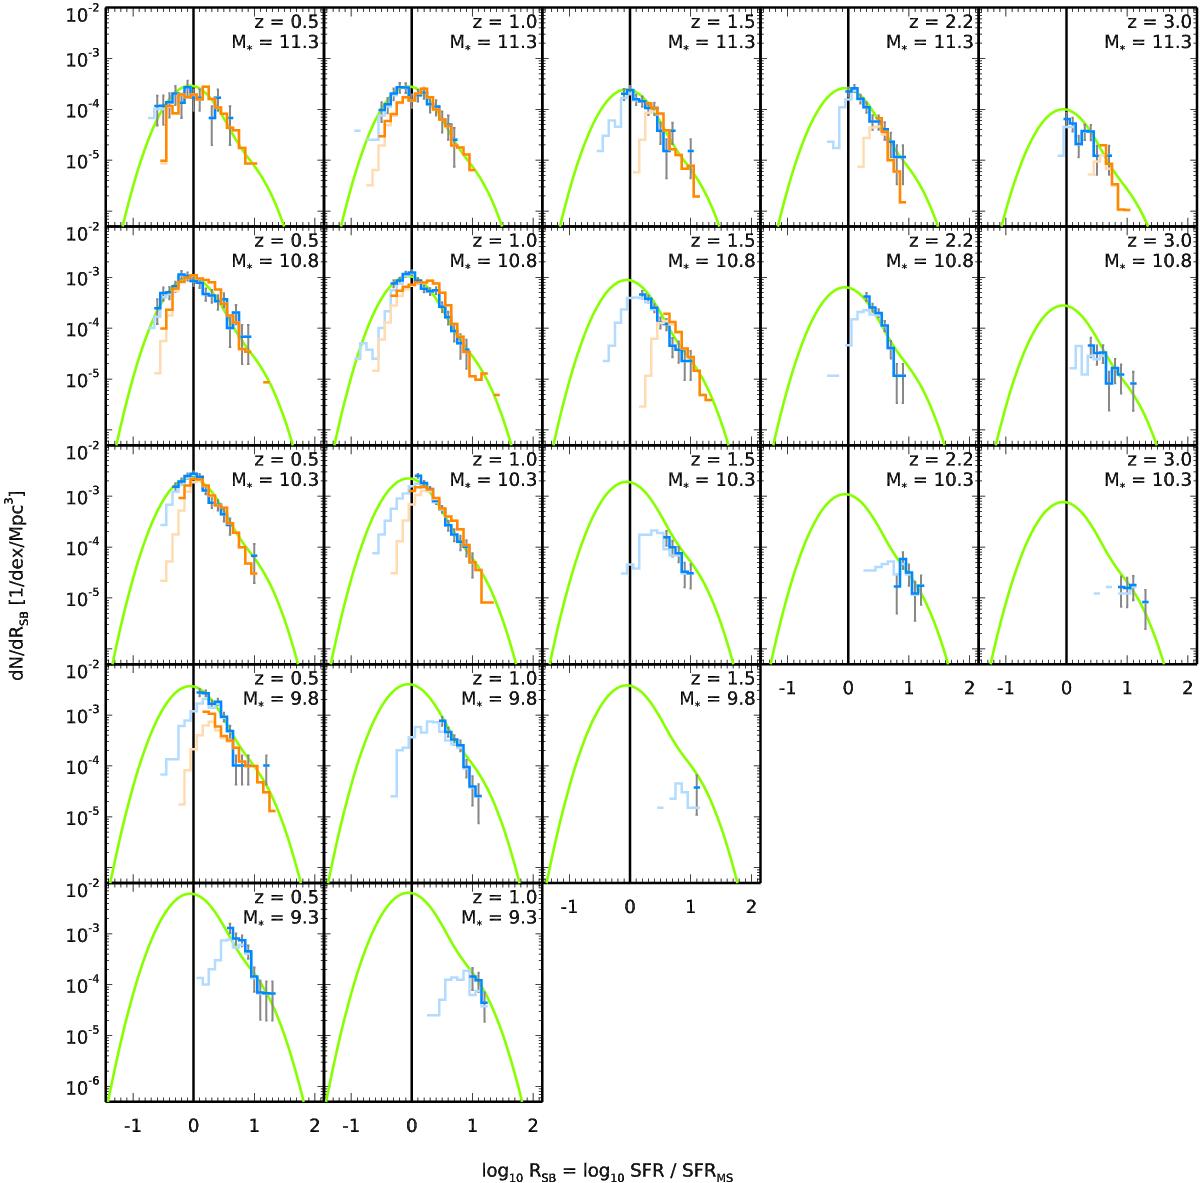
Starburstiness (RSB ≡ SFR/SFRMS) histograms of individual Herschel and Spitzer MIPS (for z< 1.2) detections in each of our redshift and stellar mass bins. The blue and orange lines correspond to the counts in the CANDELS and COSMOS 2 deg2 fields, respectively. We also show the incomplete counts in light colors in the background. The green curve shows our best-fit to the combined data set, and is the same for all bins except for the normalization, which is set by the mass function. The black vertical line shows the locus of the main sequence. Error bars indicate Poissonian noise.
Current usage metrics show cumulative count of Article Views (full-text article views including HTML views, PDF and ePub downloads, according to the available data) and Abstracts Views on Vision4Press platform.
Data correspond to usage on the plateform after 2015. The current usage metrics is available 48-96 hours after online publication and is updated daily on week days.
Initial download of the metrics may take a while.