Fig. 16
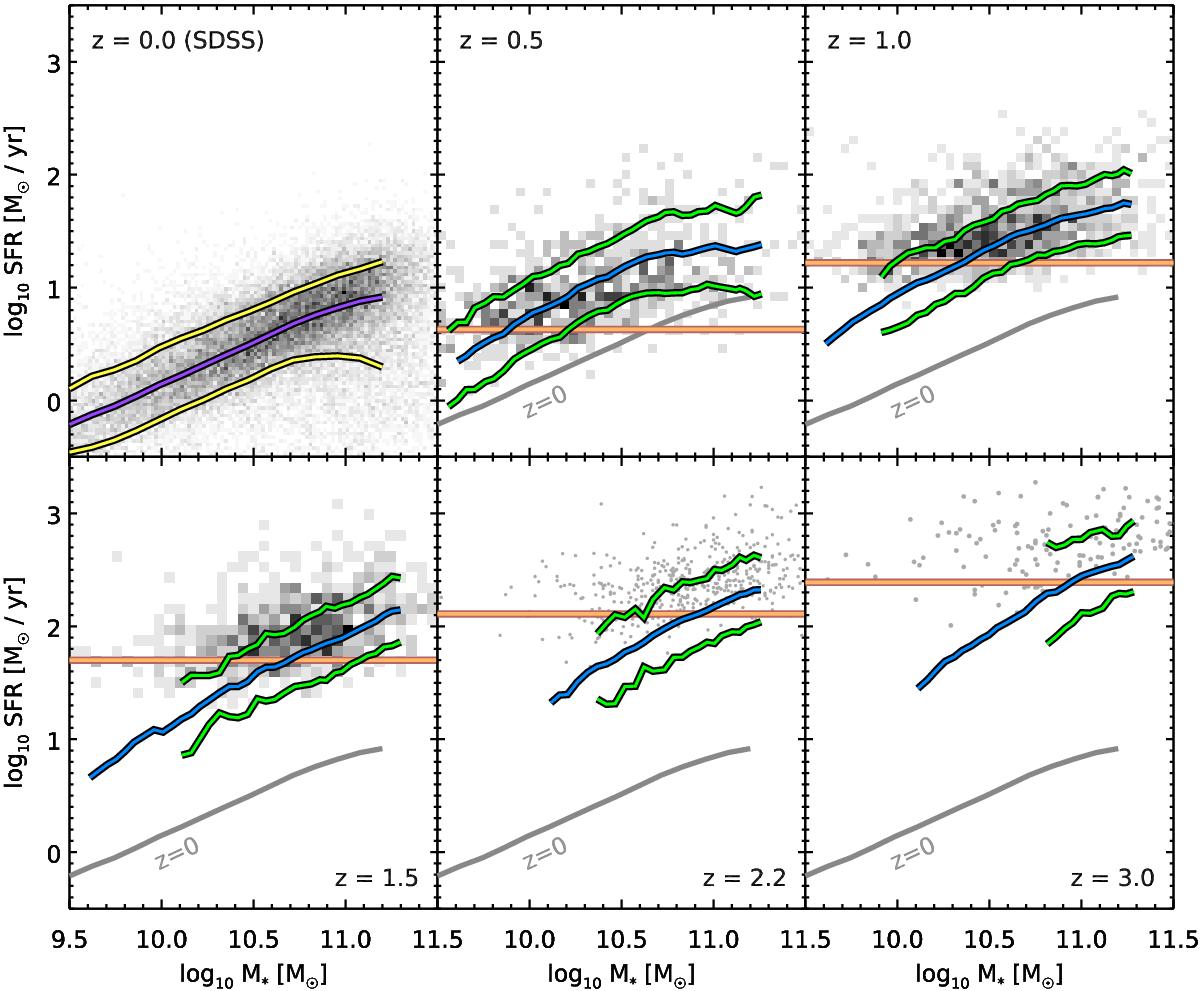
Compilation of both detections and stacking results on the SFR–M∗ plane for the CANDELS fields. Top left panel: the results obtained with the Sloan Digital Sky Survey (SDSS) in the local Universe, as presented in Elbaz et al. (2007), while each subsequent panel displays our result for increasing redshifts. The blue line shows the average stacked SFR (Sect. 4.2), and the green lines above and below show the 1σ dispersion obtained with scatter stacking (Sect. 4.4). Both of these were performed on sliding bins of mass for the sake of visualization, and for this figure only. The SFR detection limit of each sample is indicated with a solid orange line. We also show the sliding median and percentiles of the SDSS distribution with purple and yellow lines, respectively, to emphasize that both the SFR tracer and the sample selection are different (see text). This correlation, observed in the local Universe, is reproduced as a gray line on each panel. The density of individual detections is shown in gray scale in the background, except for the two highest redshift bins where we show the individual galaxies as gray filled circles.
Current usage metrics show cumulative count of Article Views (full-text article views including HTML views, PDF and ePub downloads, according to the available data) and Abstracts Views on Vision4Press platform.
Data correspond to usage on the plateform after 2015. The current usage metrics is available 48-96 hours after online publication and is updated daily on week days.
Initial download of the metrics may take a while.