Fig. 13
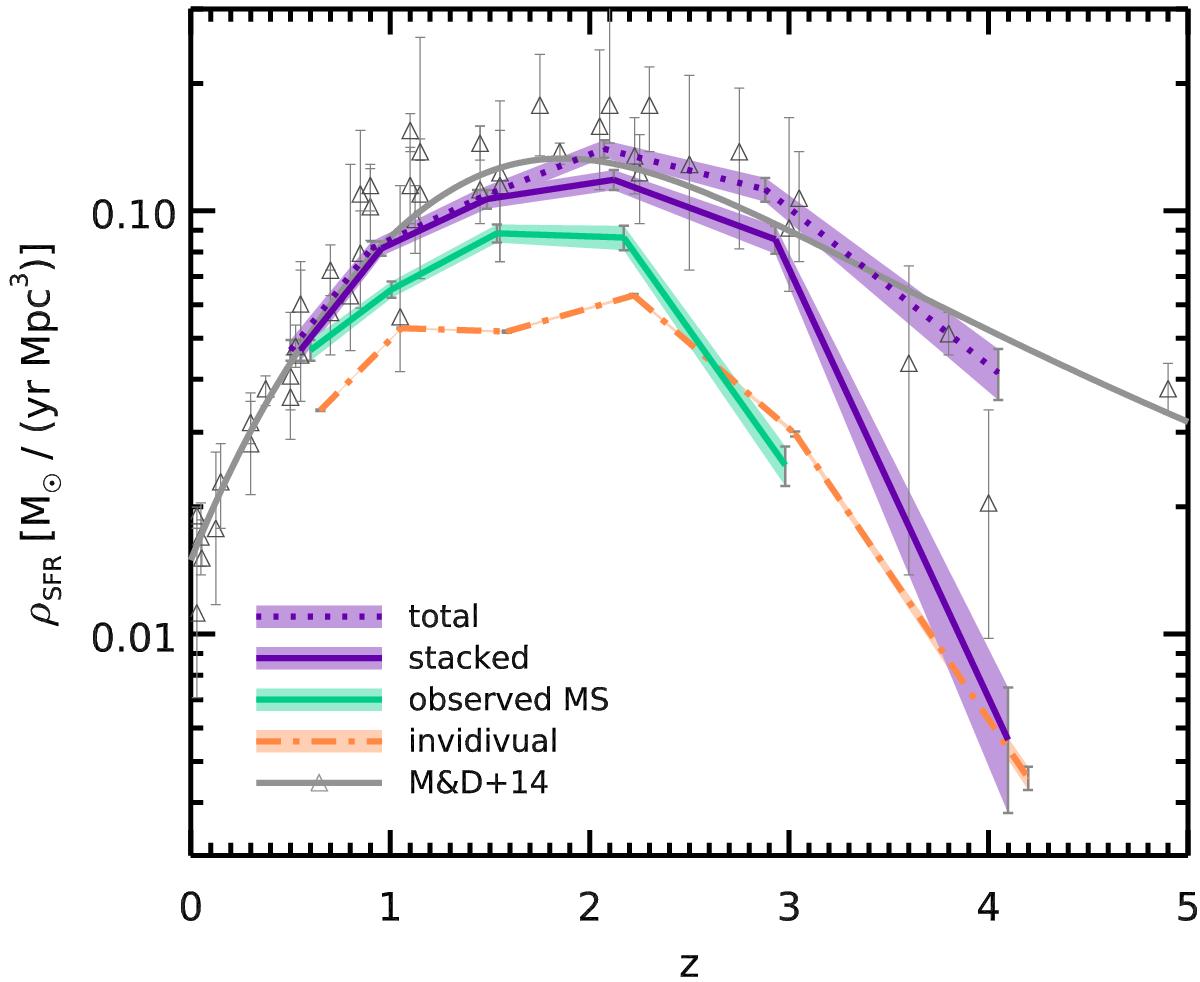
Evolution of the cosmic SFR density ρSFR with redshift. The orange dash-dotted line traces the SFR density inferred from individual Spitzer MIPS (for z< 1.5) and Herschel detections alone. The solid purple line represents the contribution of stacked sources with significant signal (>5σ), and the dotted line is the extrapolation of the stacked SFR down to M∗ = 3 × 10⁹ M⊙ assuming constant sSFR and using the mass functions of Fig. 3. The green line shows the fraction of ρSFR in regimes where we have probed the existence of the main sequence. The lines are slightly offset in redshift for clarity. Light shaded regions in the background show the corresponding 1σ statistical errors. We compare these to the literature compilation of Madau & Dickinson (2014), shown as open triangles, with their best-fit plotted as a solid gray line.
Current usage metrics show cumulative count of Article Views (full-text article views including HTML views, PDF and ePub downloads, according to the available data) and Abstracts Views on Vision4Press platform.
Data correspond to usage on the plateform after 2015. The current usage metrics is available 48-96 hours after online publication and is updated daily on week days.
Initial download of the metrics may take a while.