Fig. 12
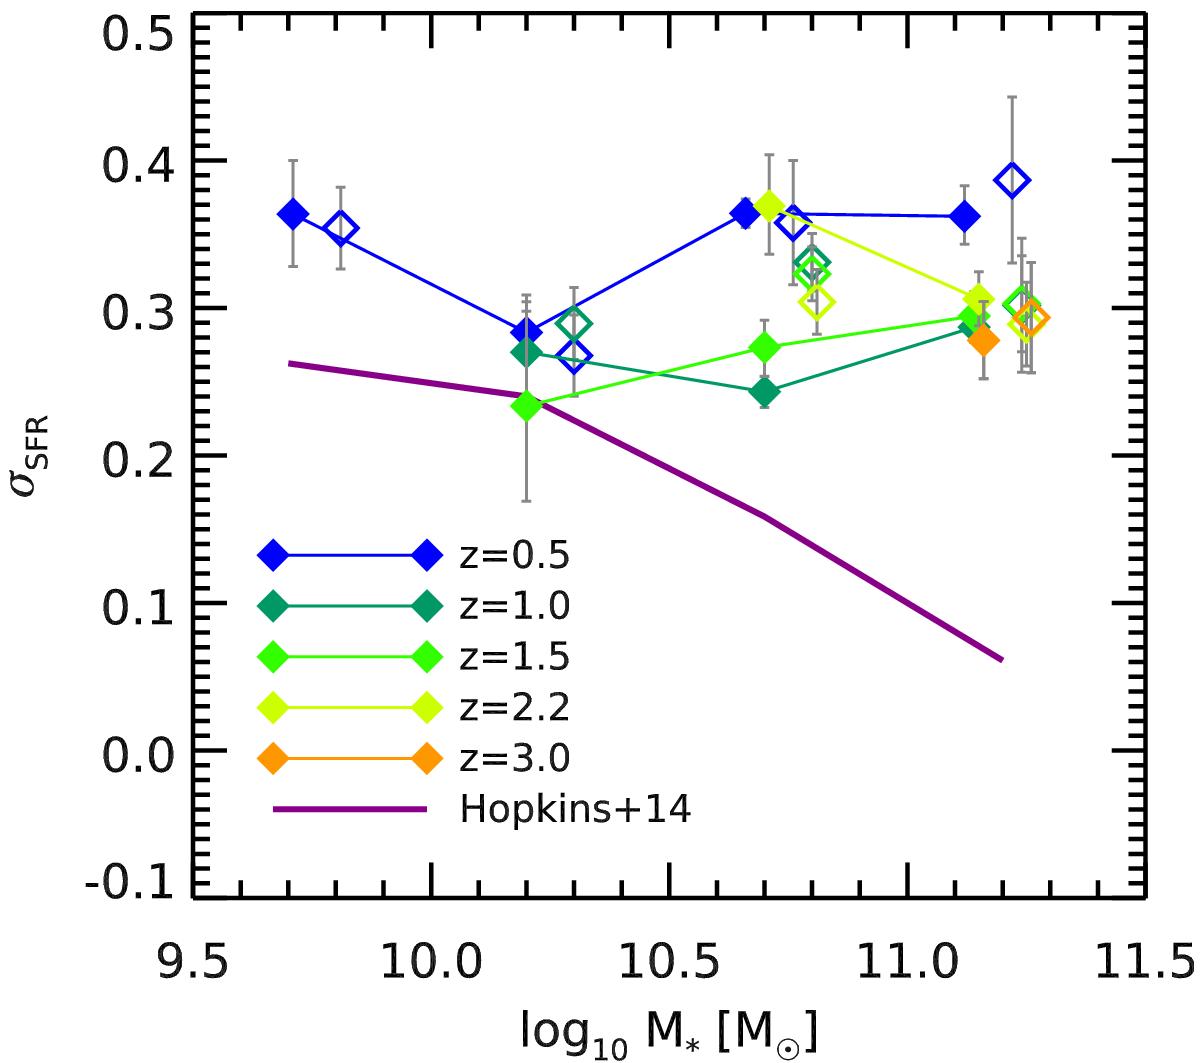
Evolution of the log 10(SFR) dispersion as a function of both redshift and stellar mass. Each color is showing a different redshift bin. Filled symbols show the result of scatter stacking, while open symbols show the dispersion estimated from individual Herschel detections above the main sequence (see text). The open symbols have been shifted up by 0.1 dex in mass for clarity. Errors are from bootstrapping in all cases. We compare these to the typical scatter of the SFHs in the numerical simulation of Hopkins et al. (2014) shown as a solid purple line.
Current usage metrics show cumulative count of Article Views (full-text article views including HTML views, PDF and ePub downloads, according to the available data) and Abstracts Views on Vision4Press platform.
Data correspond to usage on the plateform after 2015. The current usage metrics is available 48-96 hours after online publication and is updated daily on week days.
Initial download of the metrics may take a while.