Fig. 11
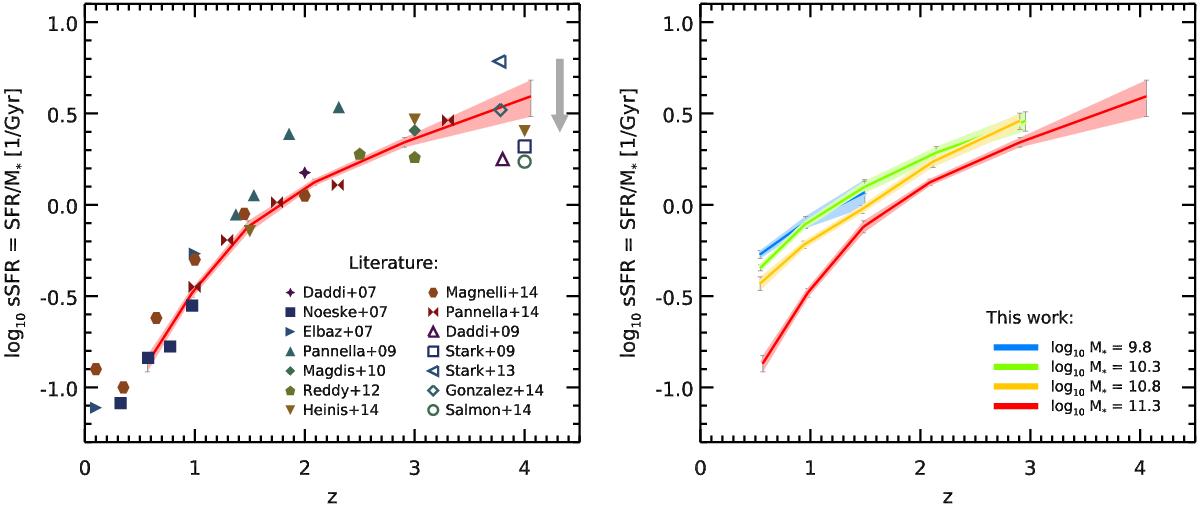
Evolution of the average sSFR of star-forming galaxies with redshift. Left: comparison of our results at M∗ = 2 × 10¹¹ M⊙ (red curve) to published values in the literature (filled and open symbols). Filled symbols compile various results that were derived from mass-complete samples with SFRs computed either from the IR (Daddi et al. 2007; Noeske et al. 2007; Elbaz et al. 2007; Magdis et al. 2010; Reddy et al. 2012; Heinis et al. 2014; Magnelli et al. 2014; Pannella et al. 2014) or the radio (Pannella et al. 2009, 2014). When possible, these were rescaled to a common stellar mass of 2 × 10¹¹ M⊙ using the corresponding published SFR–M∗ relations. Results from stacking have been corrected by −0.1 dex to reach the mode of the main sequence (see discussion in Sect. 3.2). Open symbols show results from the literature that make use of the Lyman break selection technique (LBGs) and where the SFRs are obtained from the UV light alone (Daddi et al. 2009; Stark et al. 2009, 2013; González et al. 2014; Salmon et al. 2015). These samples are mostly composed of galaxies of much lower stellar mass, typically 3 × 10⁹ M⊙, so the extrapolation to 1011 M⊙ is more uncertain. We therefore simply quote the published values. The gray arrow shows how the open symbols would move if we were to apply a mass correction assuming the z = 4 main sequence slope of Bouwens et al. (2012). When necessary, data from the literature have been converted to a Salpeter IMF. Right: same figure showing our other stacked mass bins with different colors.
Current usage metrics show cumulative count of Article Views (full-text article views including HTML views, PDF and ePub downloads, according to the available data) and Abstracts Views on Vision4Press platform.
Data correspond to usage on the plateform after 2015. The current usage metrics is available 48-96 hours after online publication and is updated daily on week days.
Initial download of the metrics may take a while.