Fig. 10
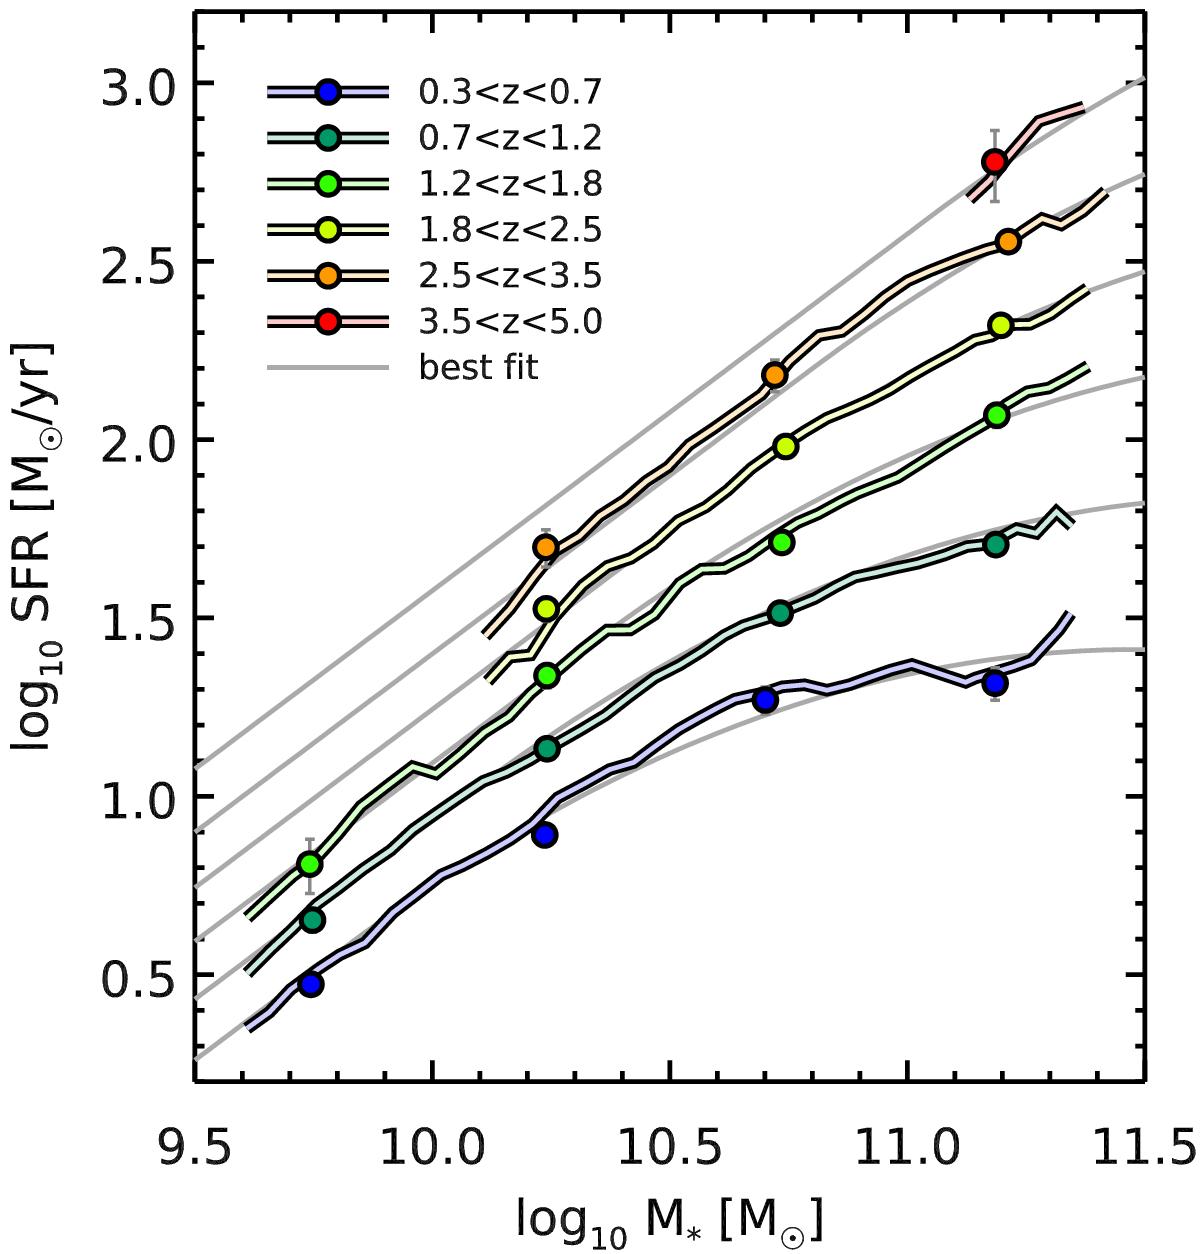
Evolution of the average SFR of star-forming galaxies with mass and redshift. Our results from stacking are shown as colored filled circles, the colors corresponding to the different redshifts as indicated in the legend. We complement these measurements by stacking sliding bins of mass (see text) for visualization purposes only to better grasp the mass dependence of the SFR. In the background, we show as light gray curves our best-fit relation for the main sequence (Eq. (9)).
Current usage metrics show cumulative count of Article Views (full-text article views including HTML views, PDF and ePub downloads, according to the available data) and Abstracts Views on Vision4Press platform.
Data correspond to usage on the plateform after 2015. The current usage metrics is available 48-96 hours after online publication and is updated daily on week days.
Initial download of the metrics may take a while.