Fig. 1
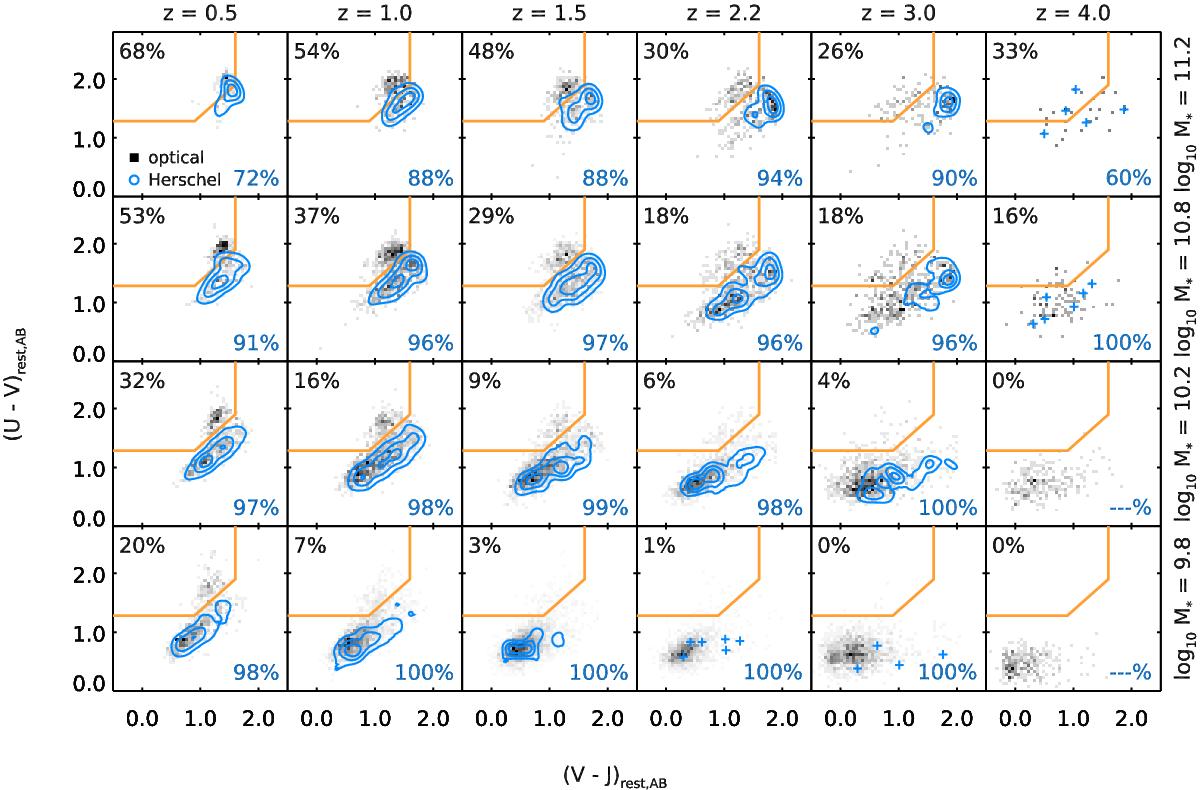
UVJ diagrams in each bin of redshift (horizontally) and mass (vertically) of our CANDELS sample. The central value of the redshift and mass bins are shown at the top and on right-hand side of the figure, respectively. The dividing line between active and passive galaxies is shown as a solid orange line on each plot, with passive galaxies located on the top-left corner. We show in the background the distribution of sources from the H-band catalogs in gray scale. We also overplot the position of sources detected with Herschel as blue contours or, when the source density is too low, as individual blue open circles. On the top-left corner of each plot, we give the fraction of H band-selected galaxies that fall inside the quiescent region, and on the bottom-right corner we show the fraction of Herschel sources that reside in the star-forming region.
Current usage metrics show cumulative count of Article Views (full-text article views including HTML views, PDF and ePub downloads, according to the available data) and Abstracts Views on Vision4Press platform.
Data correspond to usage on the plateform after 2015. The current usage metrics is available 48-96 hours after online publication and is updated daily on week days.
Initial download of the metrics may take a while.