Fig. 9
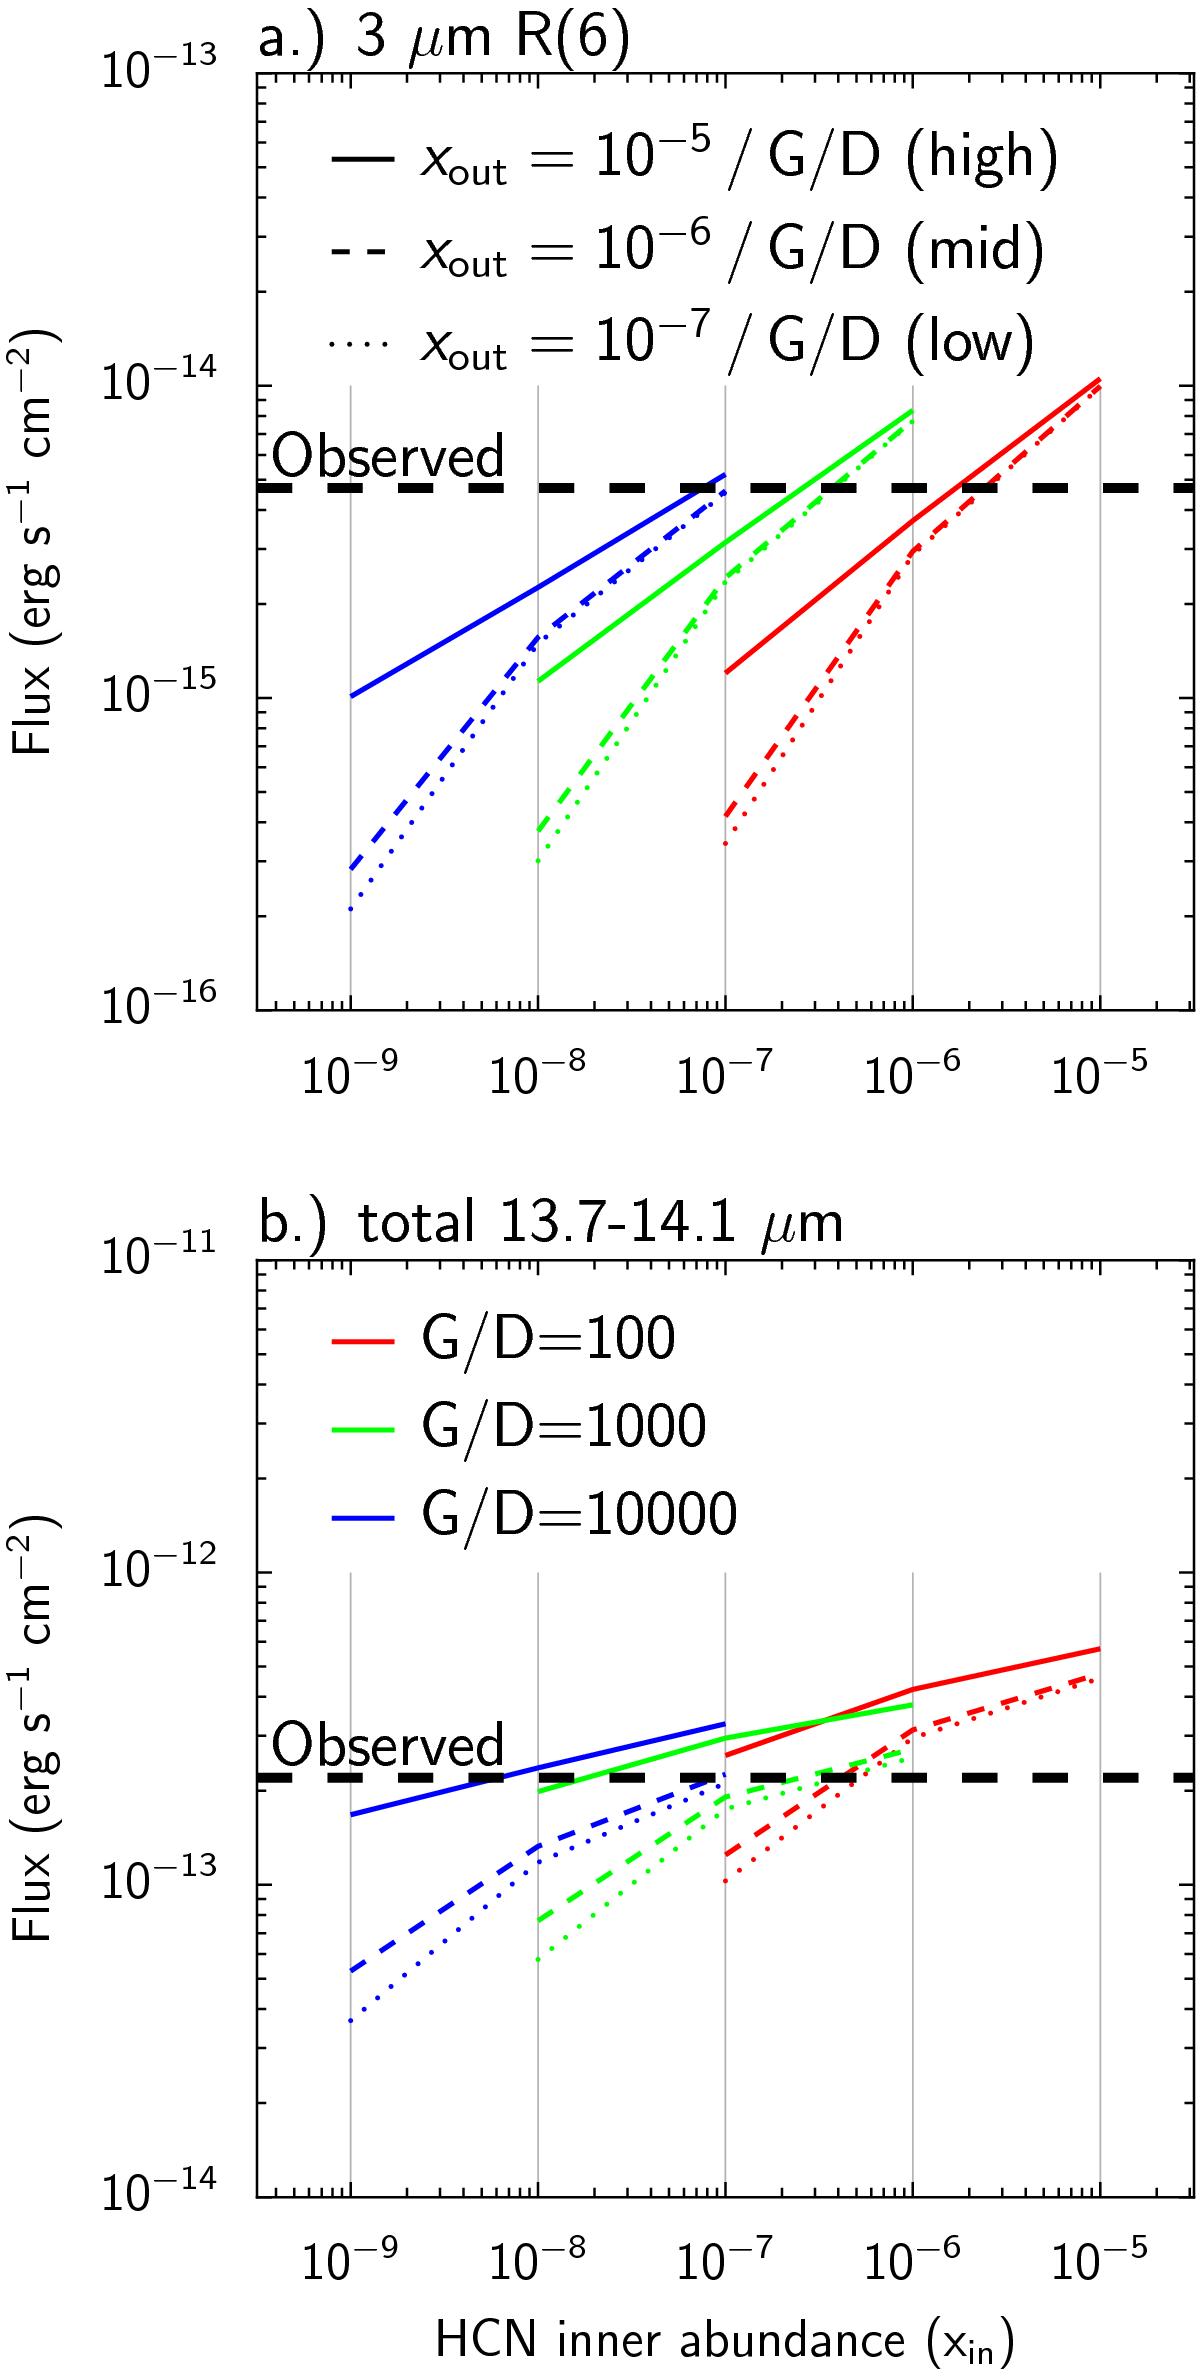
Non-LTE results of the AS 205 (N) model comparing different abundances inside (xin) and outside (xout). a) R(6) 1000−0000 line at 3 μm and b) the total HCN emission between 13.7 and 14.1 μm. The outer abundance is scaled for the gas-to-dust ratio (G/D) and takes 3 different values (e.g., 10-9, 10-8, and 10-7 for G/D = 100). Three different gas-to-dust (G/D) ratios of 100 (red), 1000 (green), and 10 000 (blue) are shown. The fluxes observed by Salyk et al. (2009; 14 μm) and Mandell et al. (2012; 3 μm) are given in black dashed lines.
Current usage metrics show cumulative count of Article Views (full-text article views including HTML views, PDF and ePub downloads, according to the available data) and Abstracts Views on Vision4Press platform.
Data correspond to usage on the plateform after 2015. The current usage metrics is available 48-96 hours after online publication and is updated daily on week days.
Initial download of the metrics may take a while.