Fig. 7
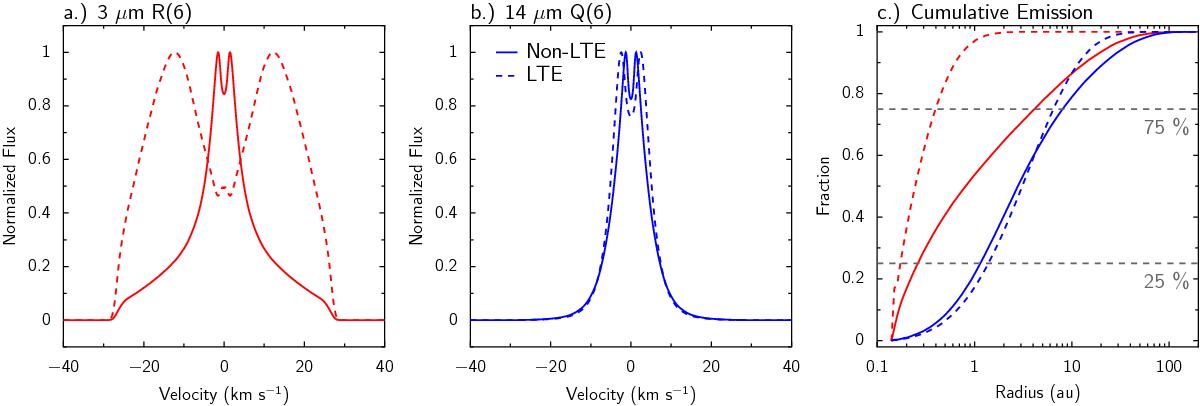
Spectrum of the a) R(6) 1000−0000 line at 3 μm and b) Q(6) 0110–0000 line at 14 μm of the AS 205 (N) model with a gas-to-dust ratio of 1000 and a constant abundance of xin = xout = 3 × 10⁻⁸. c) Contribution to the line flux within a certain radius. Results from the non-LTE and LTE model are shown in solid and dashed lines, respectively.
Current usage metrics show cumulative count of Article Views (full-text article views including HTML views, PDF and ePub downloads, according to the available data) and Abstracts Views on Vision4Press platform.
Data correspond to usage on the plateform after 2015. The current usage metrics is available 48-96 hours after online publication and is updated daily on week days.
Initial download of the metrics may take a while.