Fig. 5
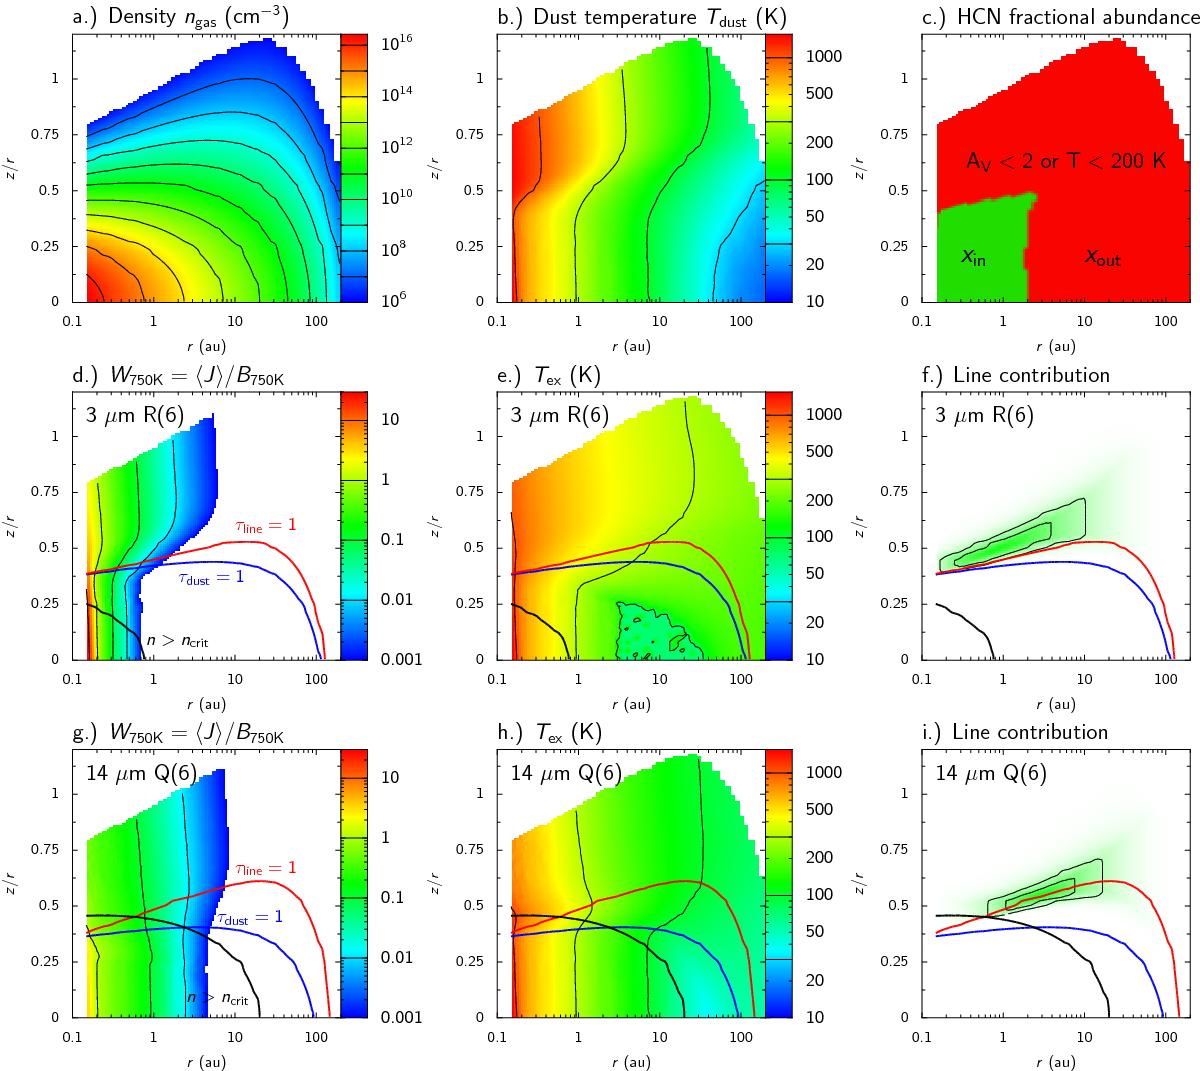
Parameters of the AS 205 (N) model compared to the formation of the R(6) 1000–0000 line at 3 μm and Q(6) 0110–0000 line at 14 μm. The model with a gas-to-dust ratio of 1000 and a constant abundance xin = xout = 3 × 10⁻⁸ is shown. a) Density structure. b) Dust temperature. c) Adopted fractional abundance of HCN. d) Continuum radiation field relative to a 750 K blackbody for the R(6) 3 μm line. Overlayed are the τ = 1 surface of the line (red) and continuum (blue) and the region where the critical density of the line is reached (black). e) Excitation temperature of the R(6) 3 μm line. f) Regions with 50 or 75% contribution to the observed flux. g)–i) As panels d)–f), but for the Q(6) 14 μm line.
Current usage metrics show cumulative count of Article Views (full-text article views including HTML views, PDF and ePub downloads, according to the available data) and Abstracts Views on Vision4Press platform.
Data correspond to usage on the plateform after 2015. The current usage metrics is available 48-96 hours after online publication and is updated daily on week days.
Initial download of the metrics may take a while.