Fig. 4
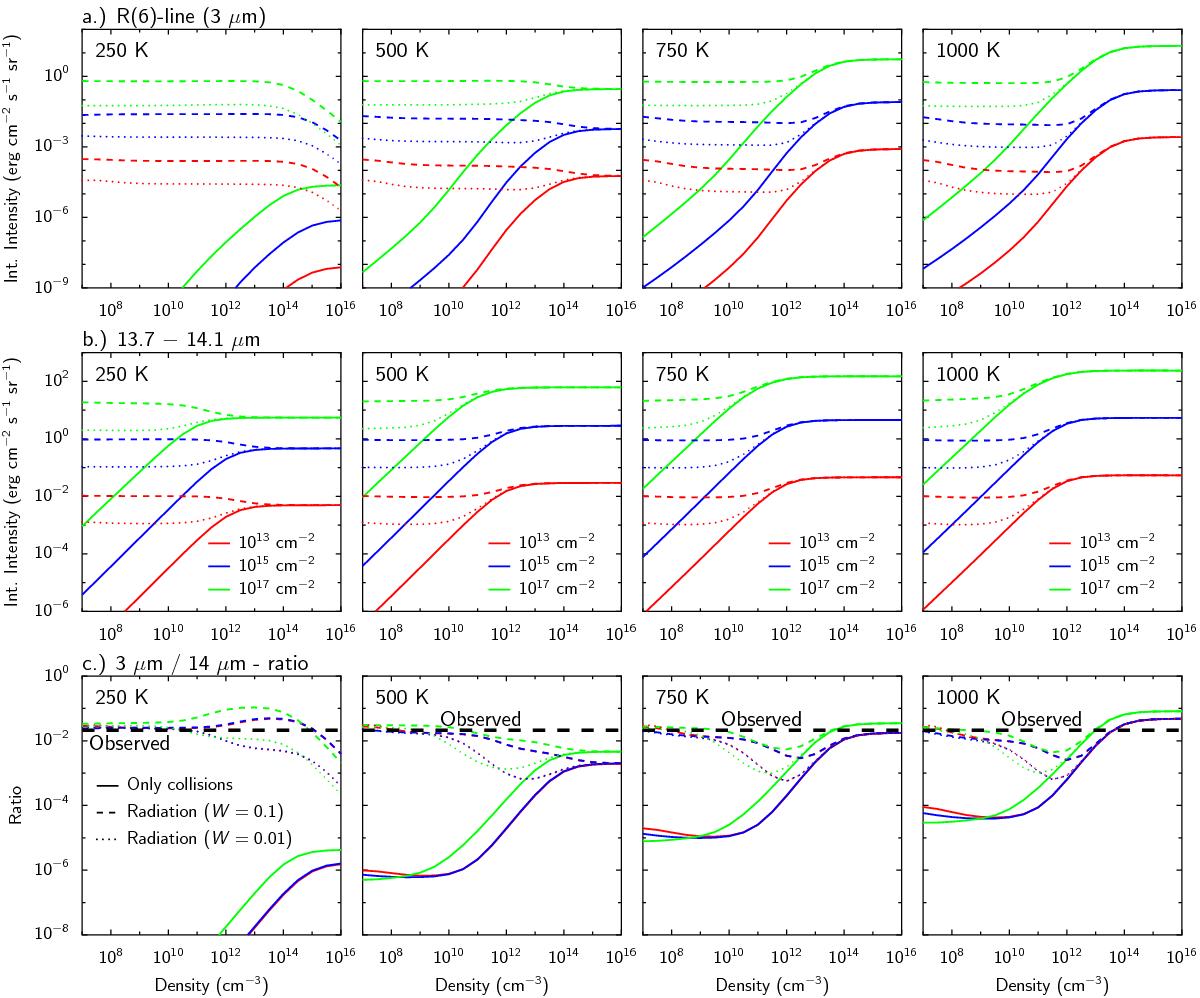
Results of slab models. a) Integrated intensity of the R(6) 1000–0000 line depending on the density for different kinetic temperatures and column densities. Solid lines show models that only consider collisions, while dashed and dotted lines represent models with a pumping radiation field of a 750 K blackbody diluted by W = 0.1 (dashed line) or W = 0.01 (dotted line). Red, blue, and green lines show results for column densities of 1013 cm-2, 1015 cm-2, and 1017 cm-2, respectively. b) Total integrated intensity of all HCN lines between 13.7 and 14.1 μm for the same parameters as panel a). c) Ratio of panels a) and b) compared to the observed ratio toward AS 205 (N).
Current usage metrics show cumulative count of Article Views (full-text article views including HTML views, PDF and ePub downloads, according to the available data) and Abstracts Views on Vision4Press platform.
Data correspond to usage on the plateform after 2015. The current usage metrics is available 48-96 hours after online publication and is updated daily on week days.
Initial download of the metrics may take a while.