Fig. C.1
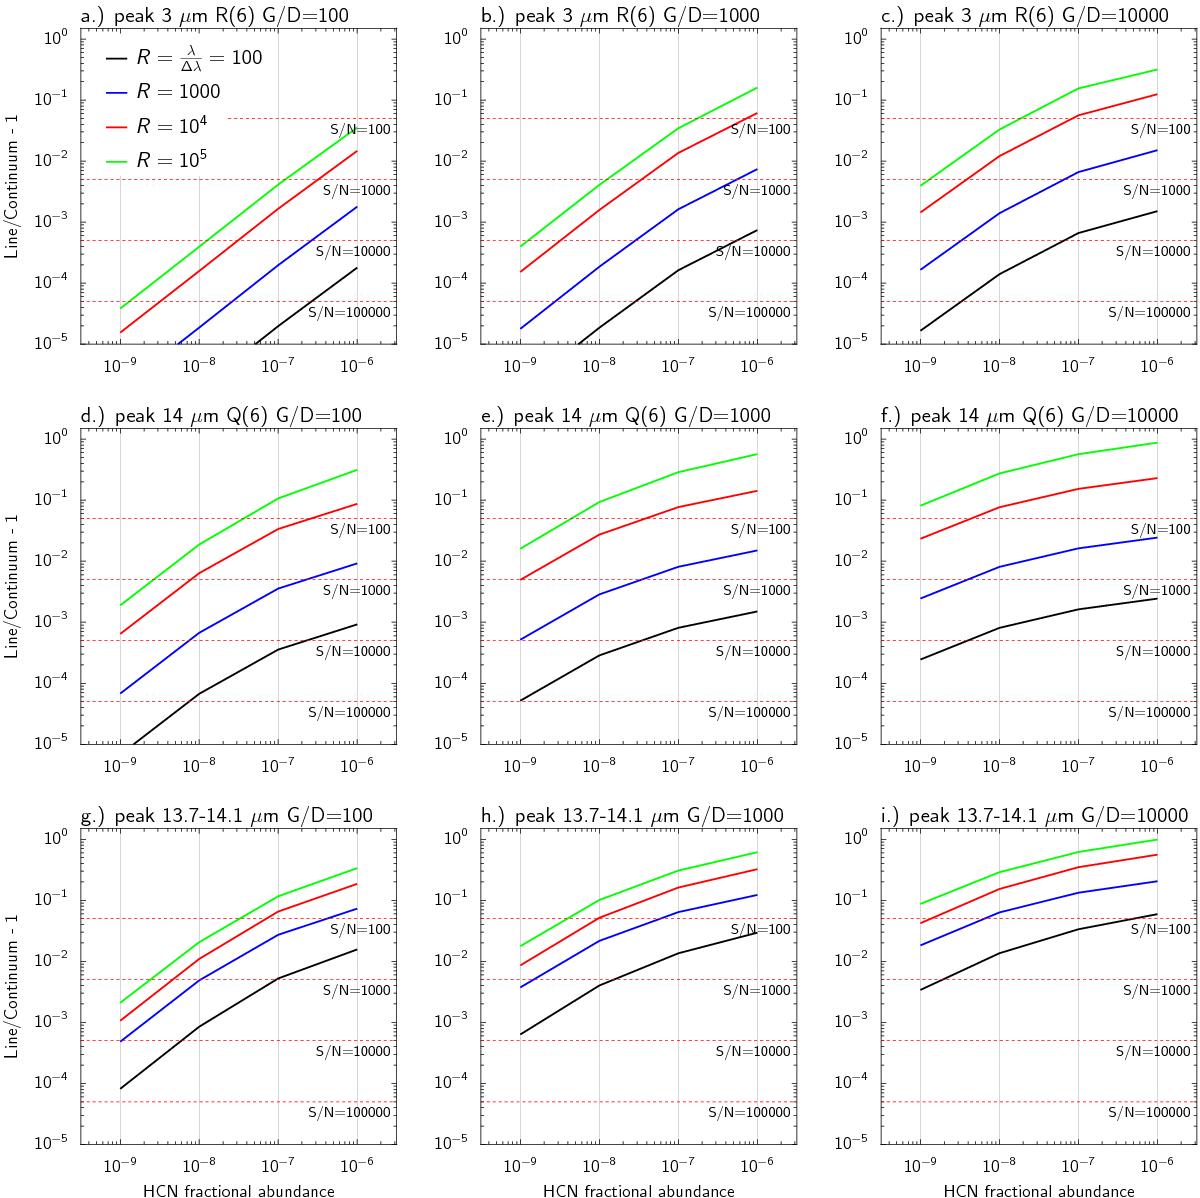
Peak line-to-continuum ratio of the a)–c) R(6) 1000–0000 line at 3 μm, d)–f) Q(6) 0110–0000 line at 14 μm, and g)–i) between 13.7 and 14.1 μm. The non-LTE models with a constant abundance and a gas-to-dust (G/D) ratio of 100, 1000 and 100 000 are shown (Fig. 6), convolved to a spectral resolving power R = λ/ Δλ between 100 and 105. Horizontal red dashed lines show the required signal-to-noise (S/N) in the continuum to detect a line at a 5σ level.
Current usage metrics show cumulative count of Article Views (full-text article views including HTML views, PDF and ePub downloads, according to the available data) and Abstracts Views on Vision4Press platform.
Data correspond to usage on the plateform after 2015. The current usage metrics is available 48-96 hours after online publication and is updated daily on week days.
Initial download of the metrics may take a while.