Fig. A.2
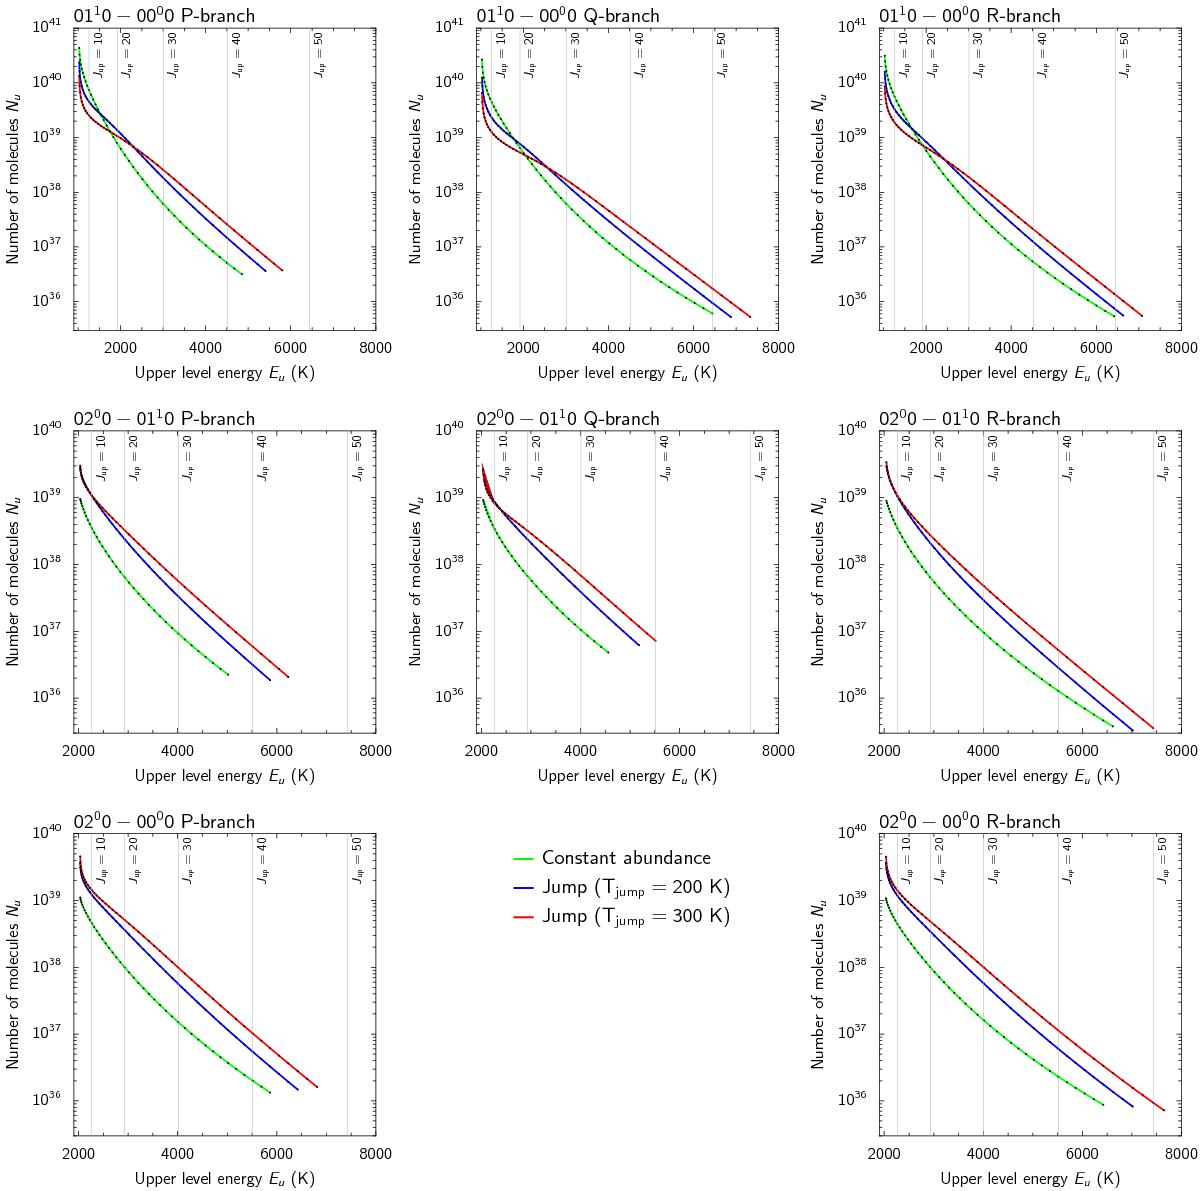
Rotational diagrams of the models given in Table 2 with G/D = 1000 and constant or jump abundance. Only lines above the detection limit of MIRI within 10 000 s (~10-20 W m-2) are shown. The x-axis shows the upper level energy Eu (K) and the y-axis the number of molecules, Nu = 4πd2F/ (Aulhνulgu), where d is the distance, F flux, Aul Einstein-A coefficient, νul transition frequency, and gu the upper level degeneracy.
Current usage metrics show cumulative count of Article Views (full-text article views including HTML views, PDF and ePub downloads, according to the available data) and Abstracts Views on Vision4Press platform.
Data correspond to usage on the plateform after 2015. The current usage metrics is available 48-96 hours after online publication and is updated daily on week days.
Initial download of the metrics may take a while.