Fig. 11
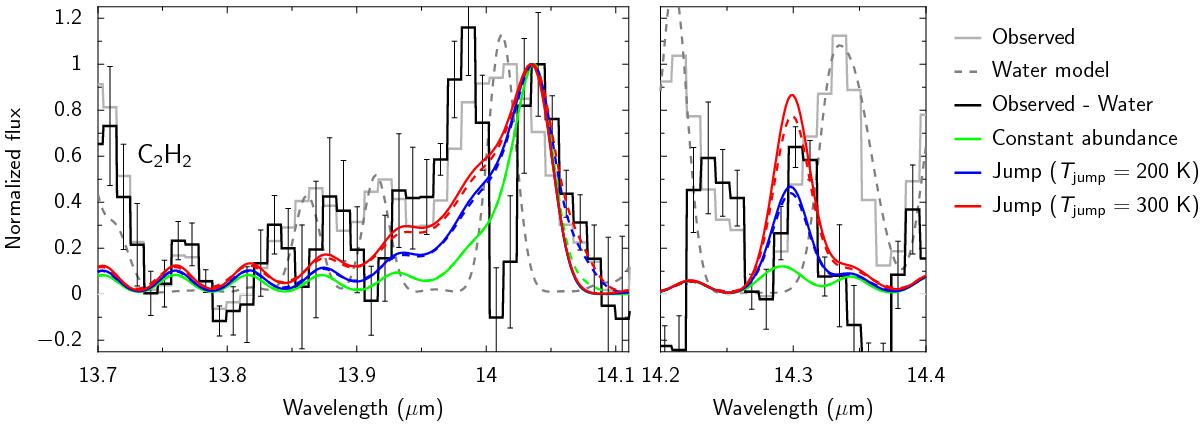
Spitzer observations compared to the models given in Table 2 with G/D = 1000 and constant or jump abundance. Dashed color lines show models including H13CN. Gray lines show the observed spectrum and the best-fit water model by Salyk et al. (2011). The black line indicates the water subtracted spectrum. The spectra are normalized to the peak of the Q-branch at around 14.05 μm.
Current usage metrics show cumulative count of Article Views (full-text article views including HTML views, PDF and ePub downloads, according to the available data) and Abstracts Views on Vision4Press platform.
Data correspond to usage on the plateform after 2015. The current usage metrics is available 48-96 hours after online publication and is updated daily on week days.
Initial download of the metrics may take a while.