Fig. 1
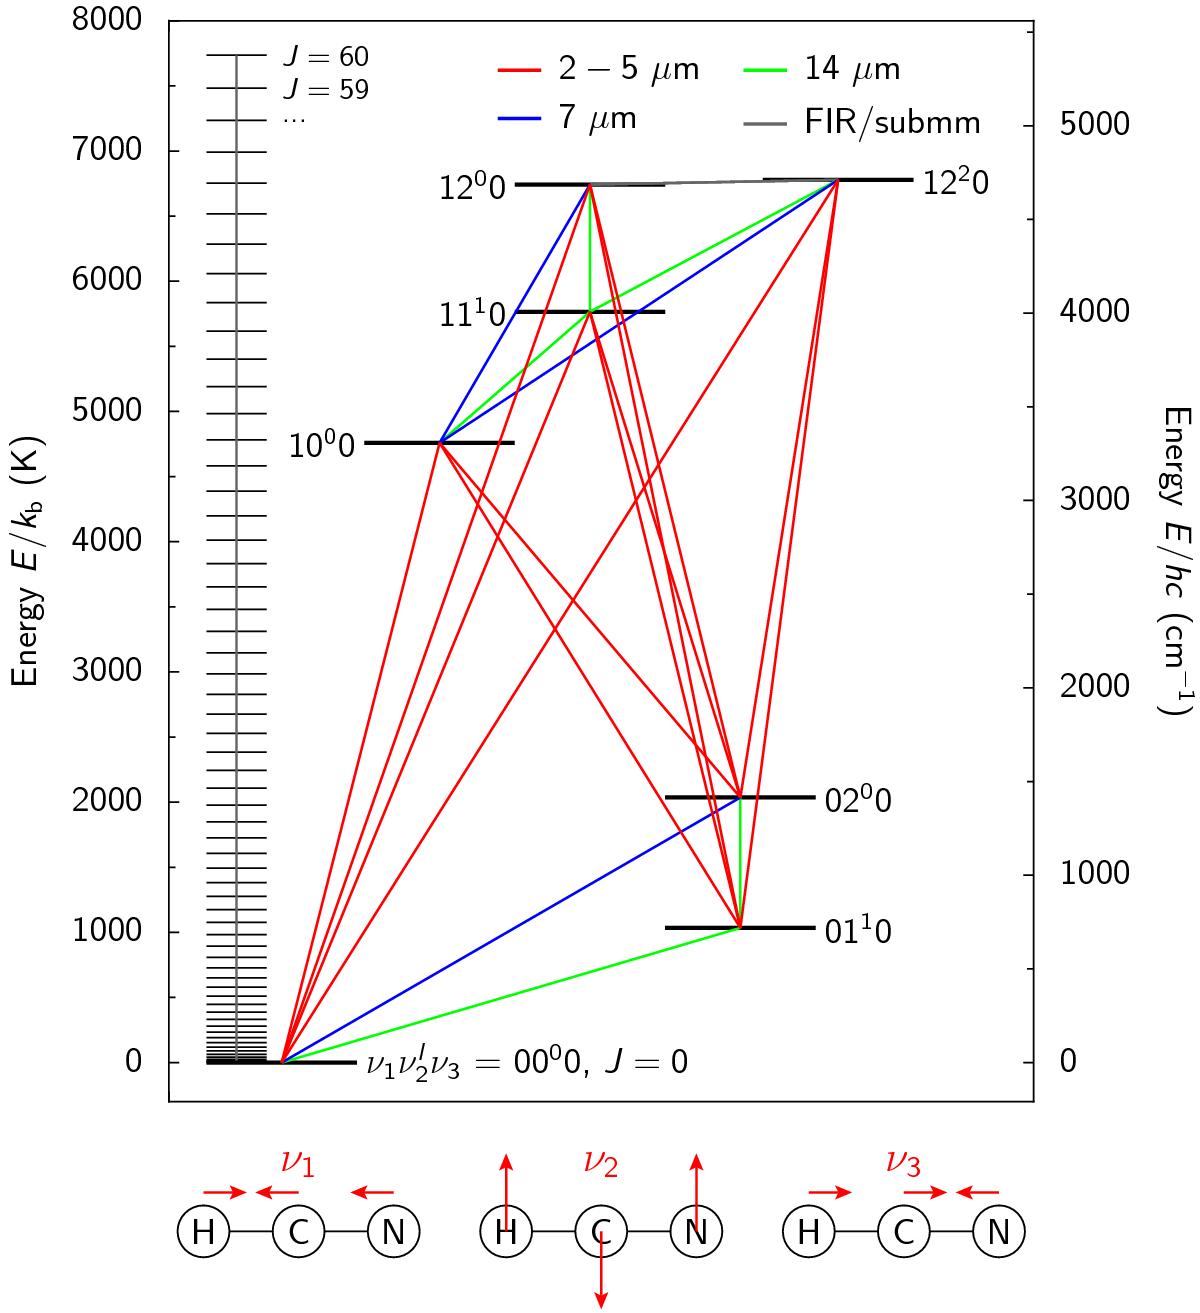
HCN level structure considered in this work. Red lines denote vibrational bands at wavelengths of 2−5 μm, while blue and green lines indicate bands at 7 μm and 14 μm, respectively. The vibrational modes ν1, ν2, and ν3 are shown below the level diagram. For clarity, the rotational ladder is only shown for the vibrational ground state.
Current usage metrics show cumulative count of Article Views (full-text article views including HTML views, PDF and ePub downloads, according to the available data) and Abstracts Views on Vision4Press platform.
Data correspond to usage on the plateform after 2015. The current usage metrics is available 48-96 hours after online publication and is updated daily on week days.
Initial download of the metrics may take a while.