Fig. 6
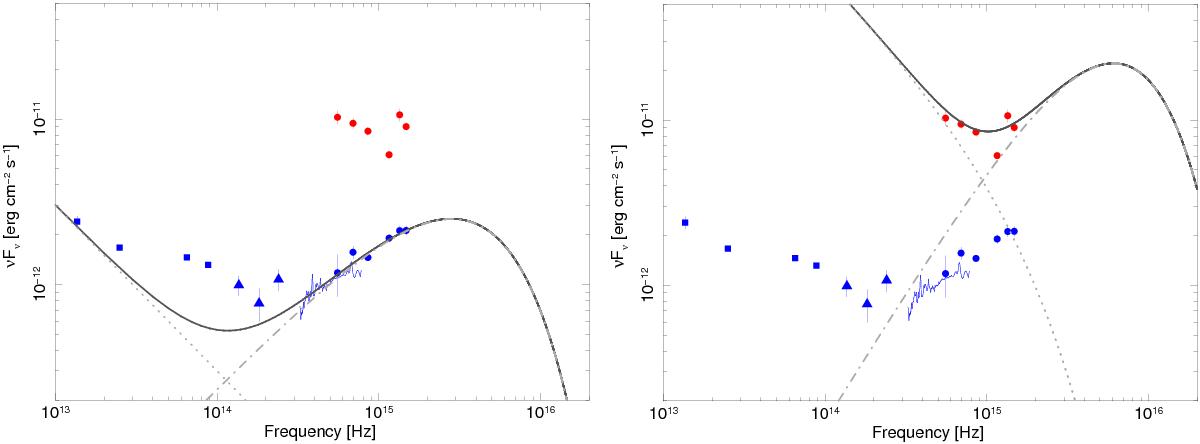
Zoom of the SED of J0948+0022 in the infrared-to-ultraviolet range. Data are from: WISE (filled squares), 2MASS (filled triangles), SDSS (continuous line), Swift/UVOT (filled circles). Left panel: blue refer to lowest observed activity state (LS, 2009 May 15); right panel: red to highest activity state (HS, 2012 December 30). The grey dot-dashed line represents a model of standard accretion disk as expected in the case of J0948+0022 (M = 7.5 × 10⁷ M⊙); the grey dotted line represents the synchrotron emission; the continuous grey line is the sum of the two models.
Current usage metrics show cumulative count of Article Views (full-text article views including HTML views, PDF and ePub downloads, according to the available data) and Abstracts Views on Vision4Press platform.
Data correspond to usage on the plateform after 2015. The current usage metrics is available 48-96 hours after online publication and is updated daily on week days.
Initial download of the metrics may take a while.