Fig. 5
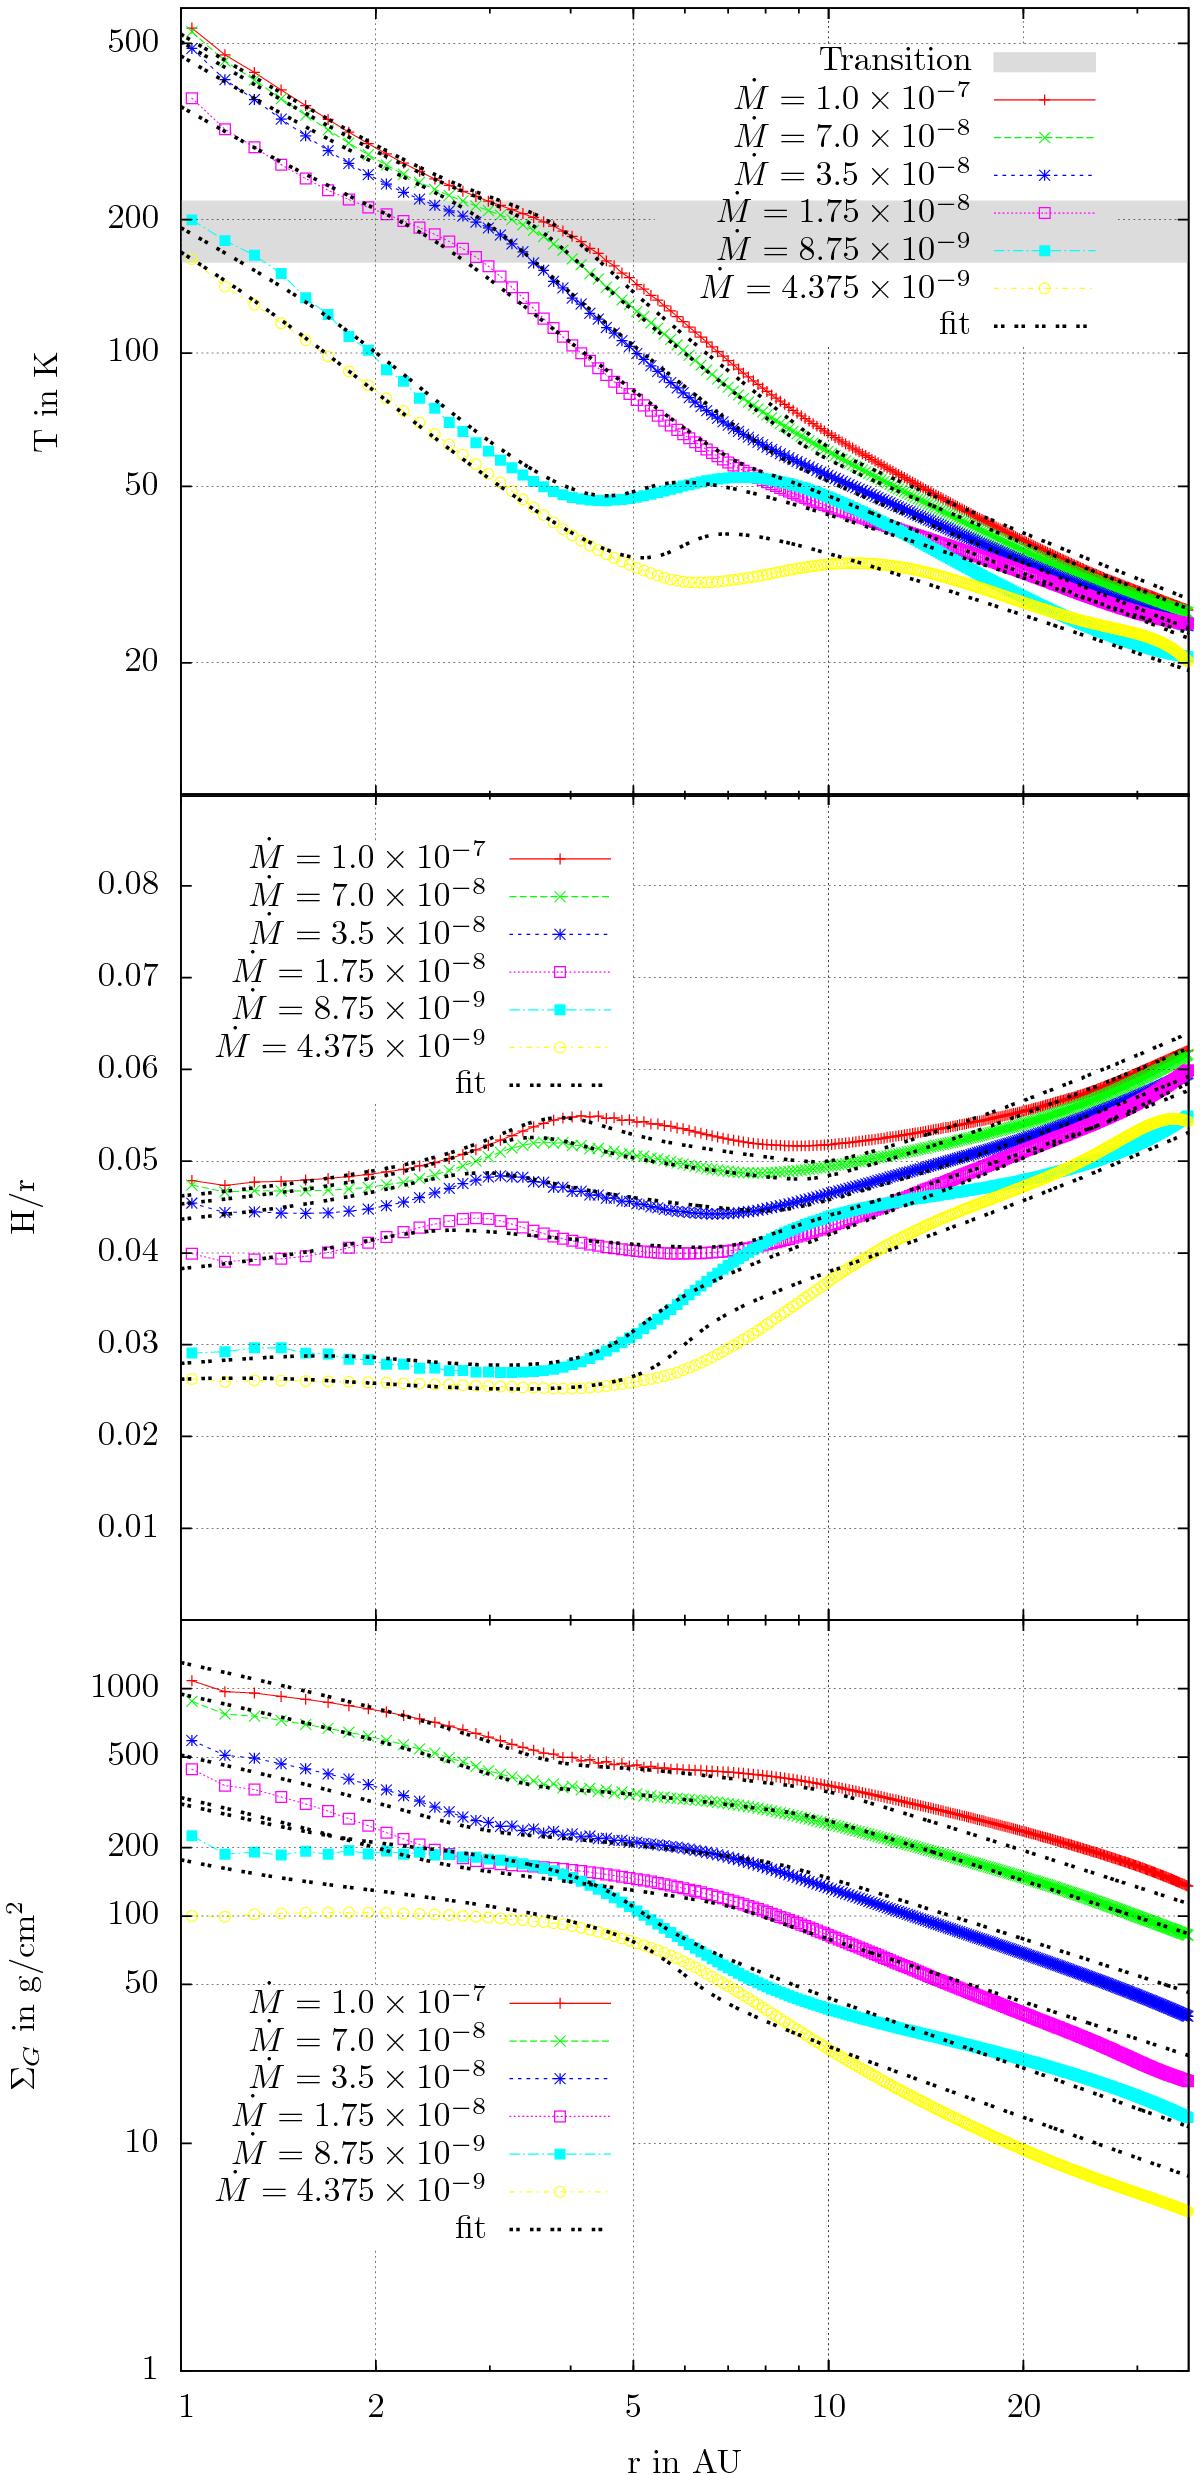
Mid-plane temperature (top), H/r (middle), and surface density ΣG (bottom) for discs with different values of Ṁ around an evolving star. The grey area in the temperature plot marks the transition range in temperature for the opacity law at the ice line. The black lines mark the fits discussed in Appendix A. For lower Ṁ rates, the inner parts of the disc are colder, as viscous heating is reduced. For very low Ṁ, the temperature is below the ice condensation temperature throughout the disc’s mid plane, and therefore the bump in the inner part of the protoplanetary disc vanishes.
Current usage metrics show cumulative count of Article Views (full-text article views including HTML views, PDF and ePub downloads, according to the available data) and Abstracts Views on Vision4Press platform.
Data correspond to usage on the plateform after 2015. The current usage metrics is available 48-96 hours after online publication and is updated daily on week days.
Initial download of the metrics may take a while.