Fig. 3
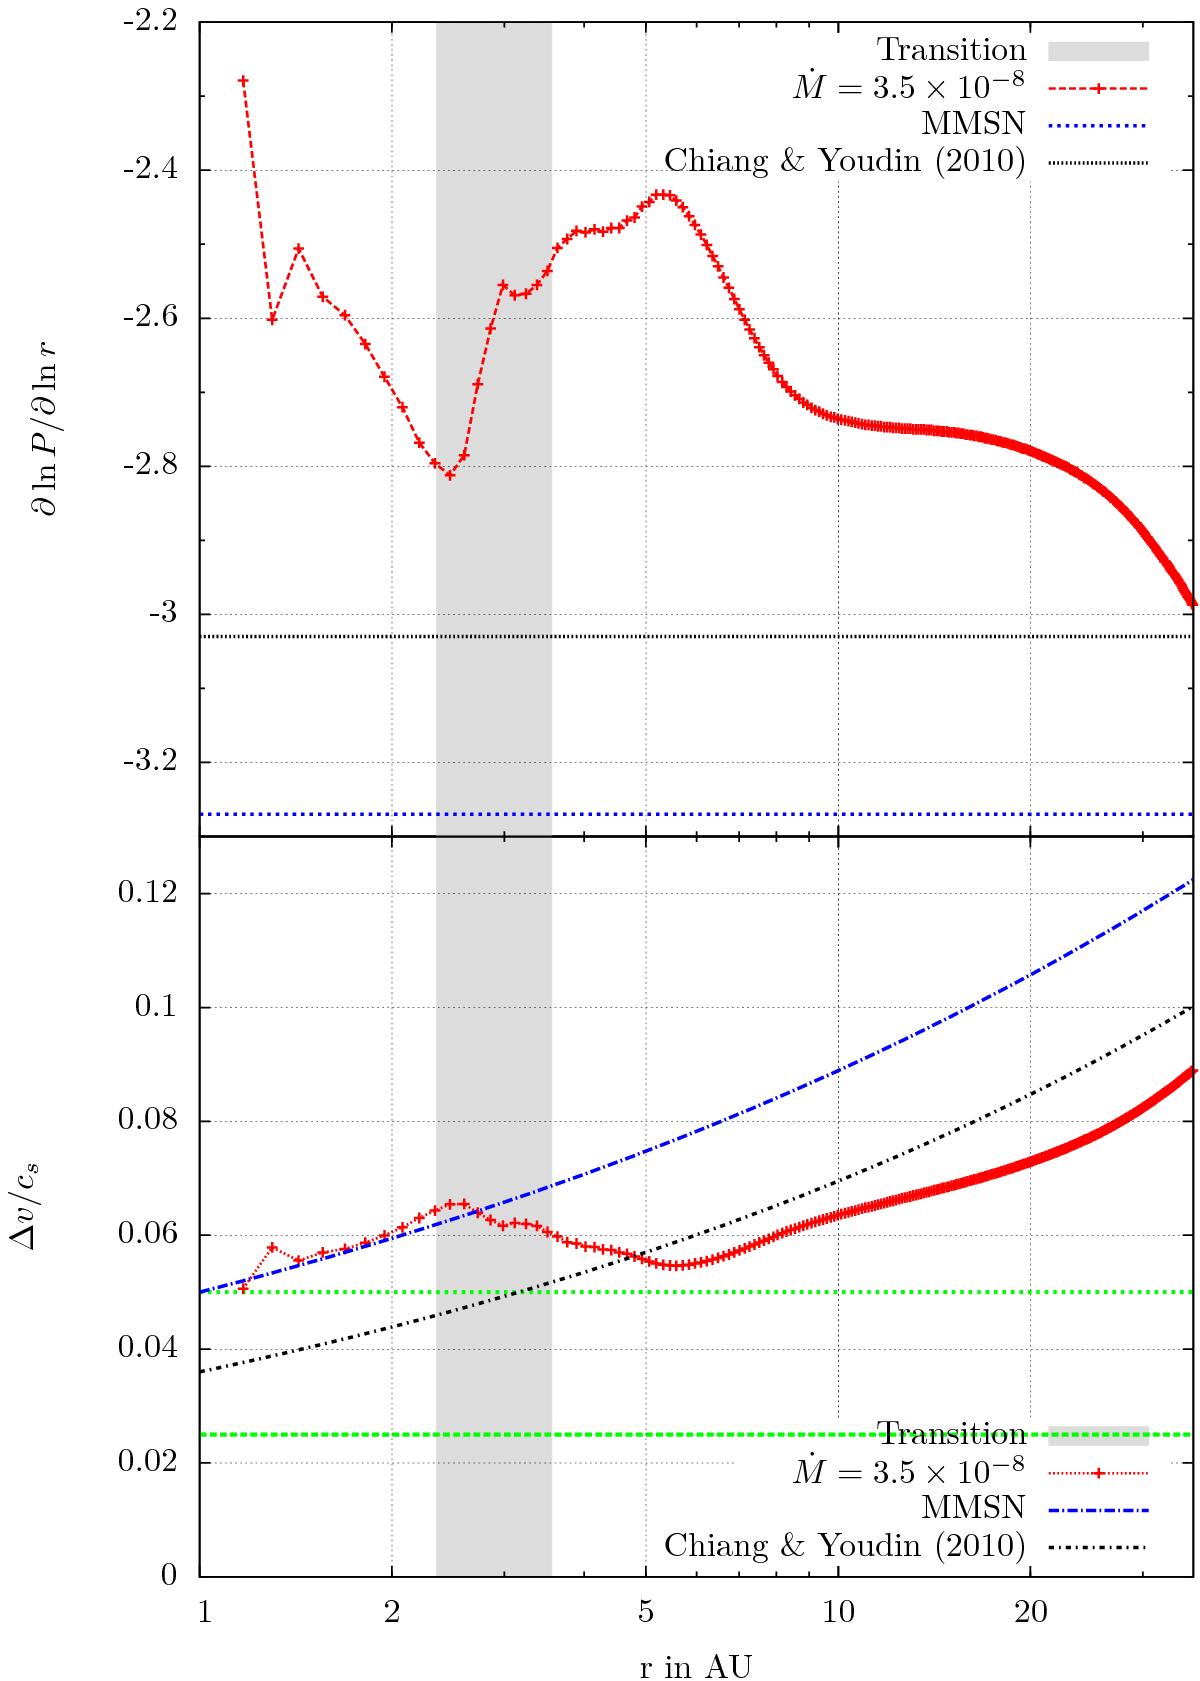
Radial pressure gradient (top) and pressure support parameter Δ = Δv/cs (bottom) for the disc with Ṁ = 3.5 × 10⁻⁸ M⊙/yr and for the MMSN and CY2010 models. The grey area indicates the radial range of the opacity transition at the ice line, as already indicated in Fig. 2. In contrast to the MMSN and CY2010 models that have a constant pressure gradient and therefore a steadily increasing Δ parameter, the Ṁ model features a dip in the profile at ≈5 AU, which makes the formation of planetesimals in this region more likely. The reduced Δ parameter in the outer parts of the disc also makes it more likely to form planetesimals there compared to the MMSN and CY2010 model. The horizontal green lines at Δ = 0.025 and Δ = 0.05 mark the amount of heavy elements in the disc needed for the streaming instability to operate (≈1.5% and ≈2%, respectively), see Bai & Stone (2010b).
Current usage metrics show cumulative count of Article Views (full-text article views including HTML views, PDF and ePub downloads, according to the available data) and Abstracts Views on Vision4Press platform.
Data correspond to usage on the plateform after 2015. The current usage metrics is available 48-96 hours after online publication and is updated daily on week days.
Initial download of the metrics may take a while.