Free Access
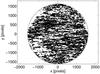
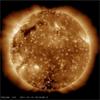
Fig. 1
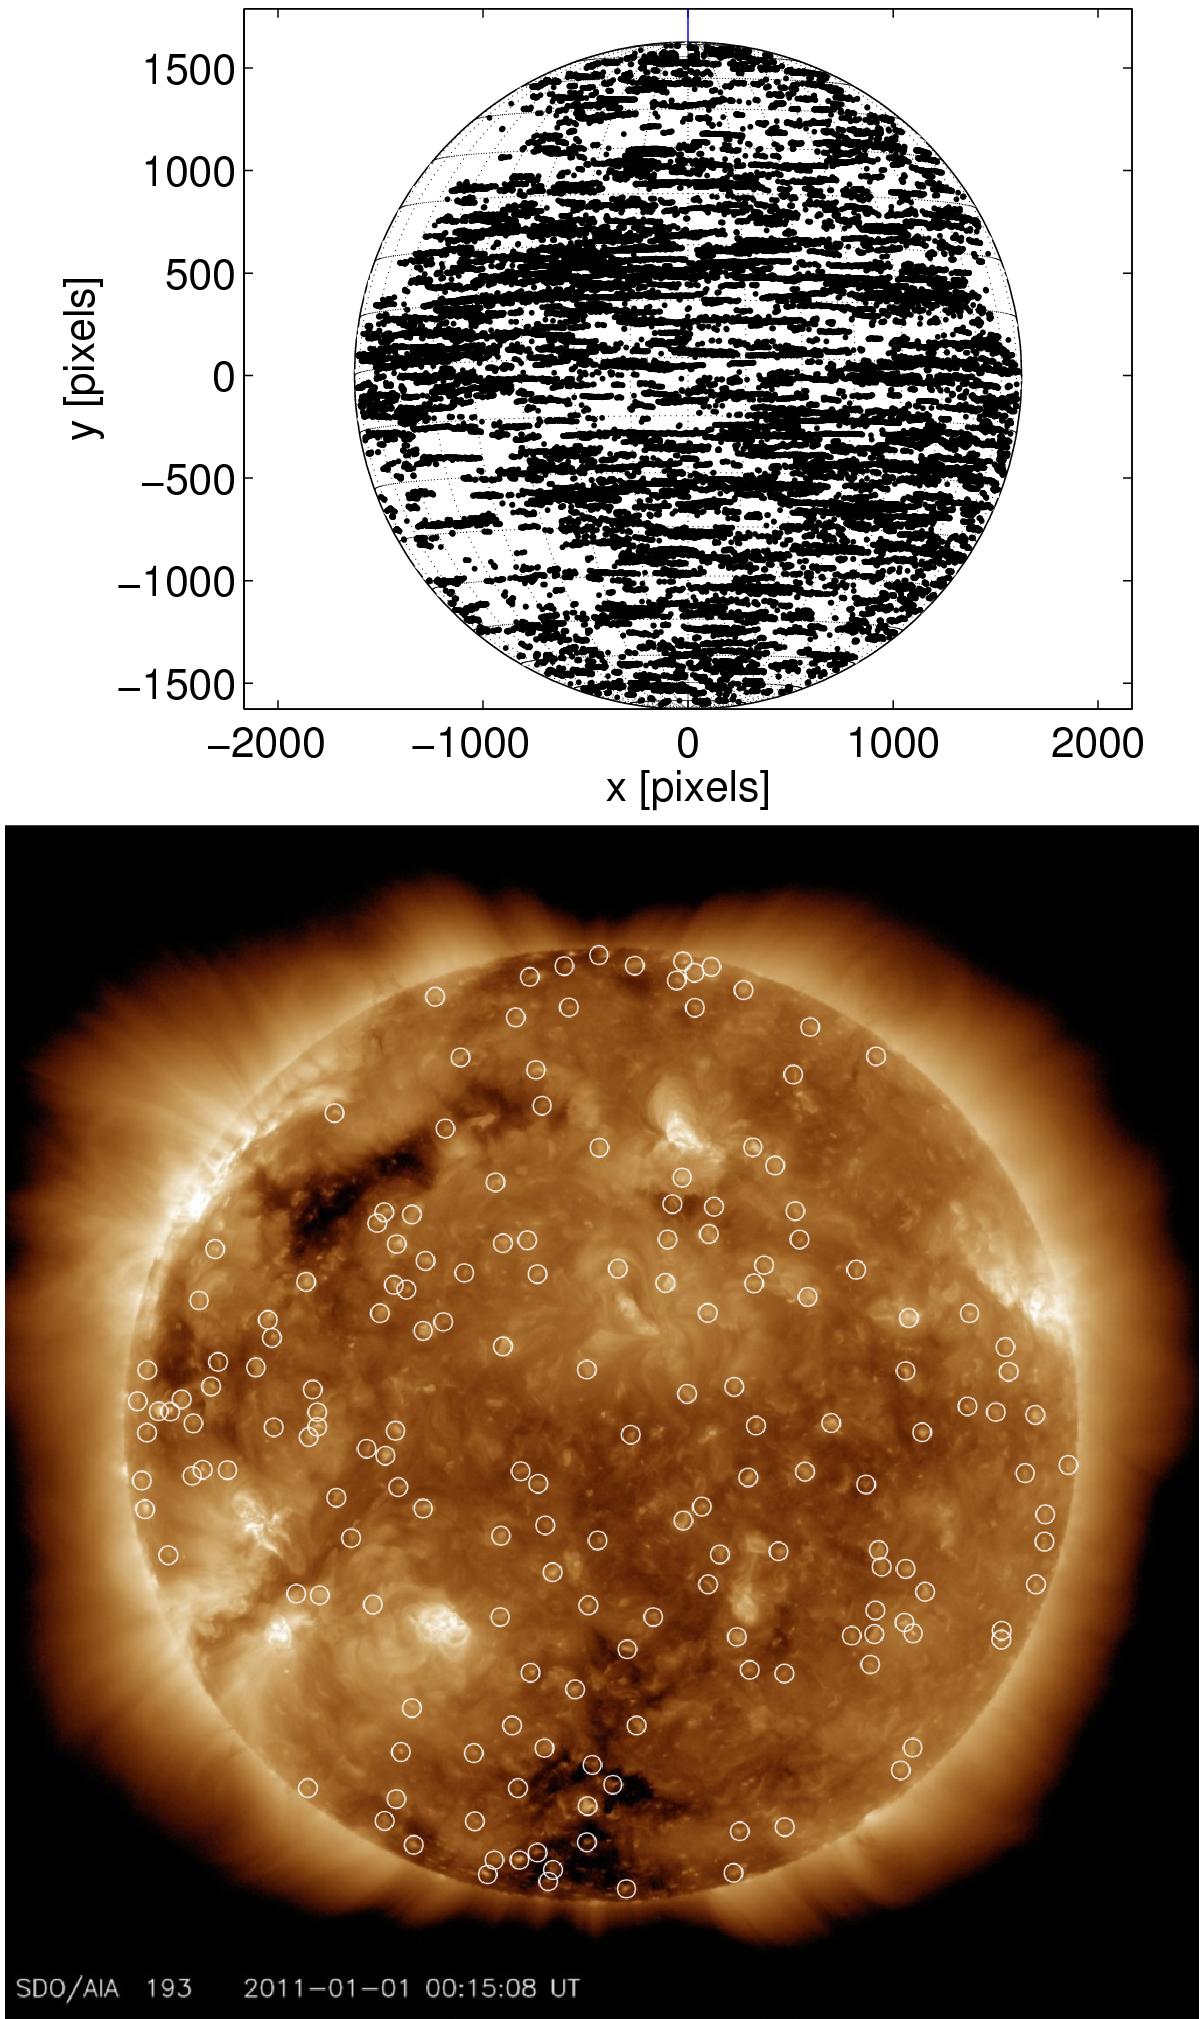
Distribution of CBPs detected by the segmentation algorithm (top panel) and image of the Sun in the 19.3 nm channel obtained by SDO/AIA on 1st of January 2011. White circles show detected CBPs on this image (bottom panel).
This figure is made of several images, please see below:
Current usage metrics show cumulative count of Article Views (full-text article views including HTML views, PDF and ePub downloads, according to the available data) and Abstracts Views on Vision4Press platform.
Data correspond to usage on the plateform after 2015. The current usage metrics is available 48-96 hours after online publication and is updated daily on week days.
Initial download of the metrics may take a while.