Fig. 9
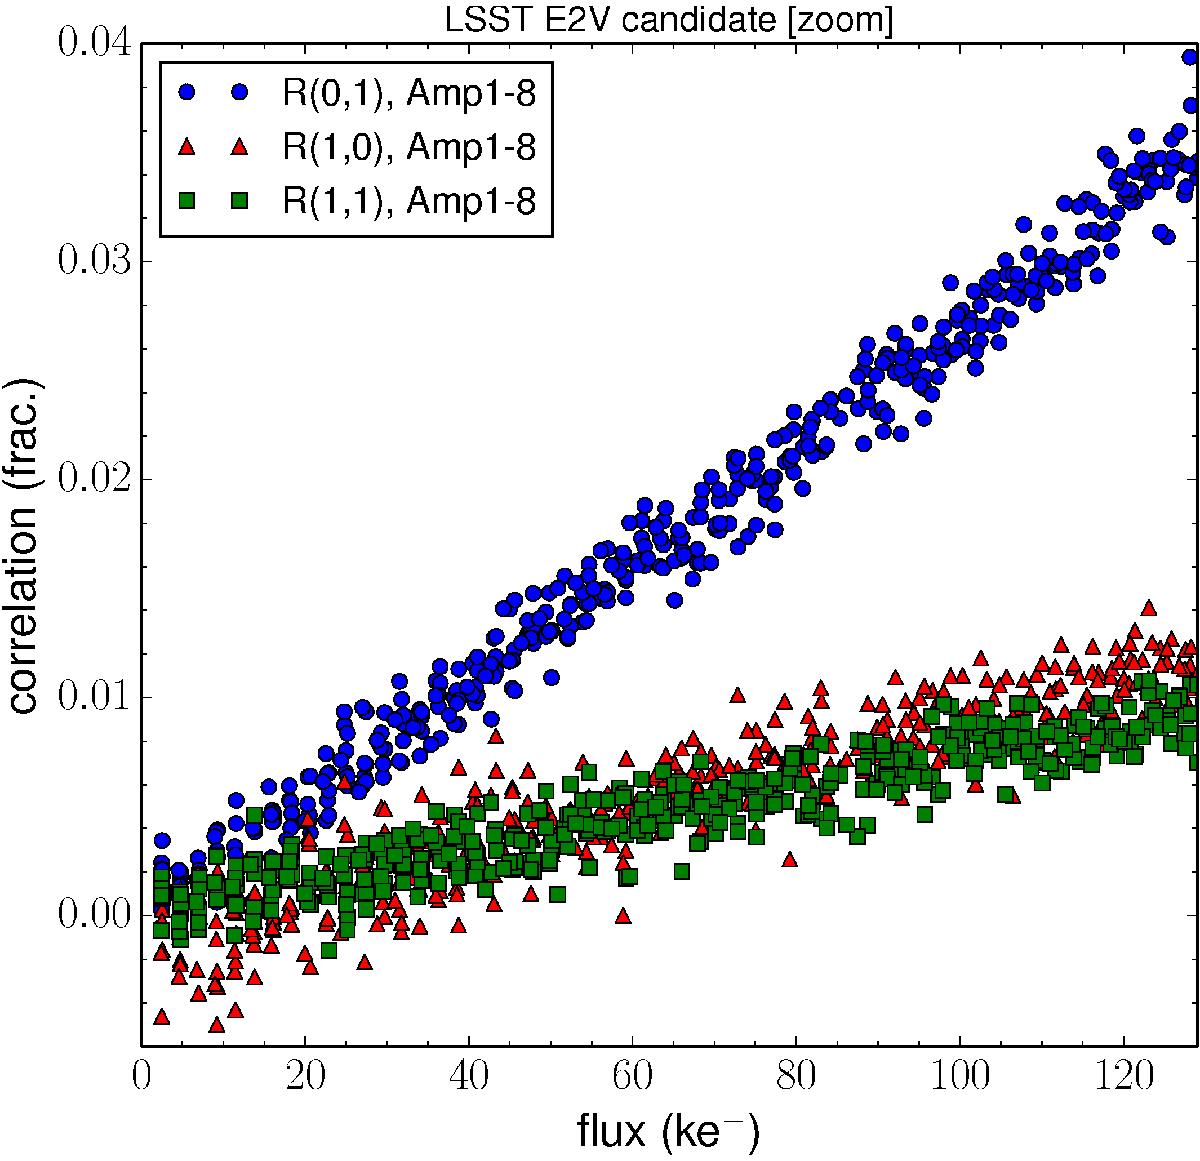
Superposition of evolution with respect to flux of coefficients R0,1R1,1, and R1,0 on the dynamical range below the threshold, as indicated by the vertical black line of Fig. 6. On this interval, all the linearly increasing correlations that are discussed in this section shows a monotonic behavior. On this CCD E2V-250, most channels exhibit a small (≈–0.003), but significant anti-correlation pedestal in R1,0 (Y-intercept), an offset that is not seen with the others coefficients nor with the other sensors. We attribute it to the electronic chain used to collect this data, and we subtract it to the actual measurements.
Current usage metrics show cumulative count of Article Views (full-text article views including HTML views, PDF and ePub downloads, according to the available data) and Abstracts Views on Vision4Press platform.
Data correspond to usage on the plateform after 2015. The current usage metrics is available 48-96 hours after online publication and is updated daily on week days.
Initial download of the metrics may take a while.