Free Access
Fig. 8
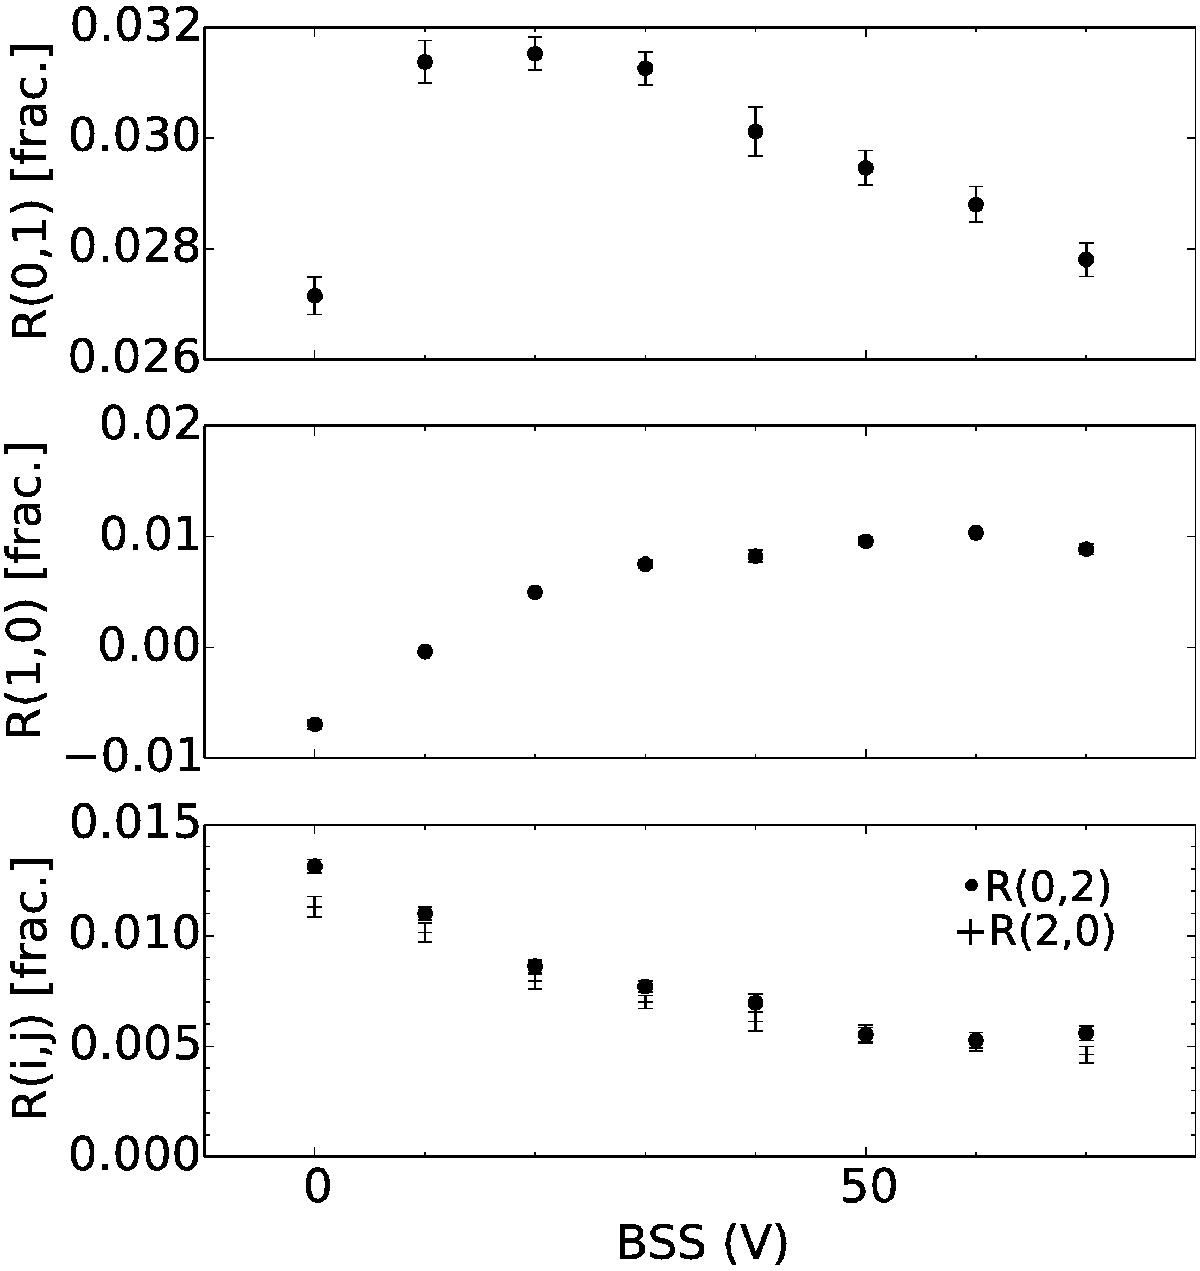
Variation of correlation coefficients (measured at 100 ke−) with respect to BSS measured on the CCD E2V-250. Top panel: R0,1. Middle panel: R1,0. Bottom panel: R0,2 and R2,0. The other long range correlations behave like R0,2 and R2,0: they decrease as the BSS voltage increases.
Current usage metrics show cumulative count of Article Views (full-text article views including HTML views, PDF and ePub downloads, according to the available data) and Abstracts Views on Vision4Press platform.
Data correspond to usage on the plateform after 2015. The current usage metrics is available 48-96 hours after online publication and is updated daily on week days.
Initial download of the metrics may take a while.