Fig. 20
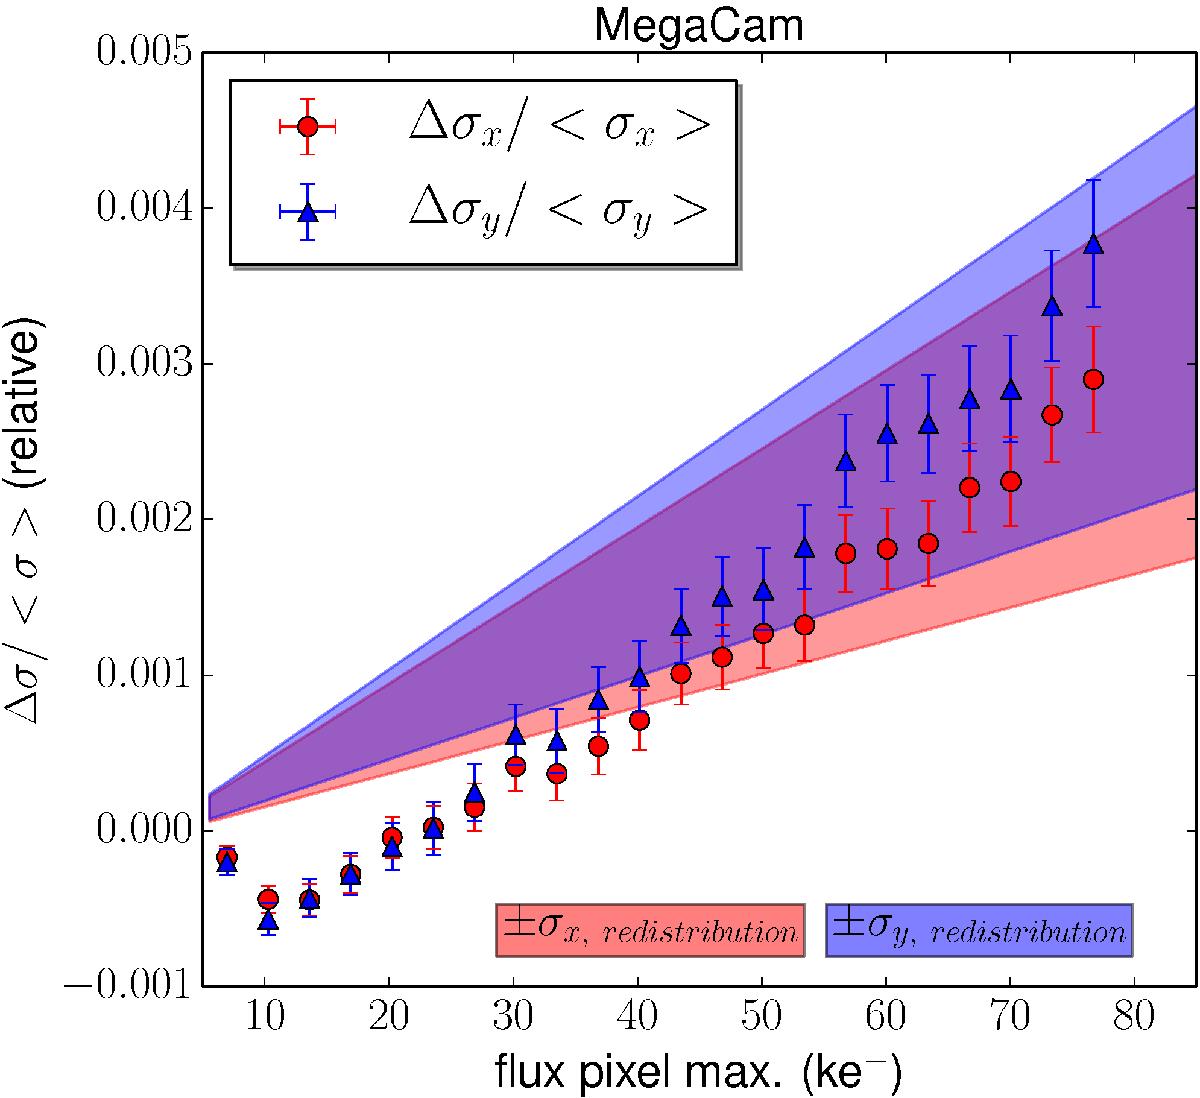
Average brighter-fatter slope in the X and Y direction for the MegaCam mosaic. The observations gather all the deep field (D1) r-band images of the CFHTLS (≈1.8 M stars). The redistribution prediction is based on the mean correlations of all the CCDs; this is necessary to palliate the lack of statistics given the small frame of the flatfields data set. The prediction is compatible with the observations but with a significant uncertainty.
Current usage metrics show cumulative count of Article Views (full-text article views including HTML views, PDF and ePub downloads, according to the available data) and Abstracts Views on Vision4Press platform.
Data correspond to usage on the plateform after 2015. The current usage metrics is available 48-96 hours after online publication and is updated daily on week days.
Initial download of the metrics may take a while.