Fig. 19
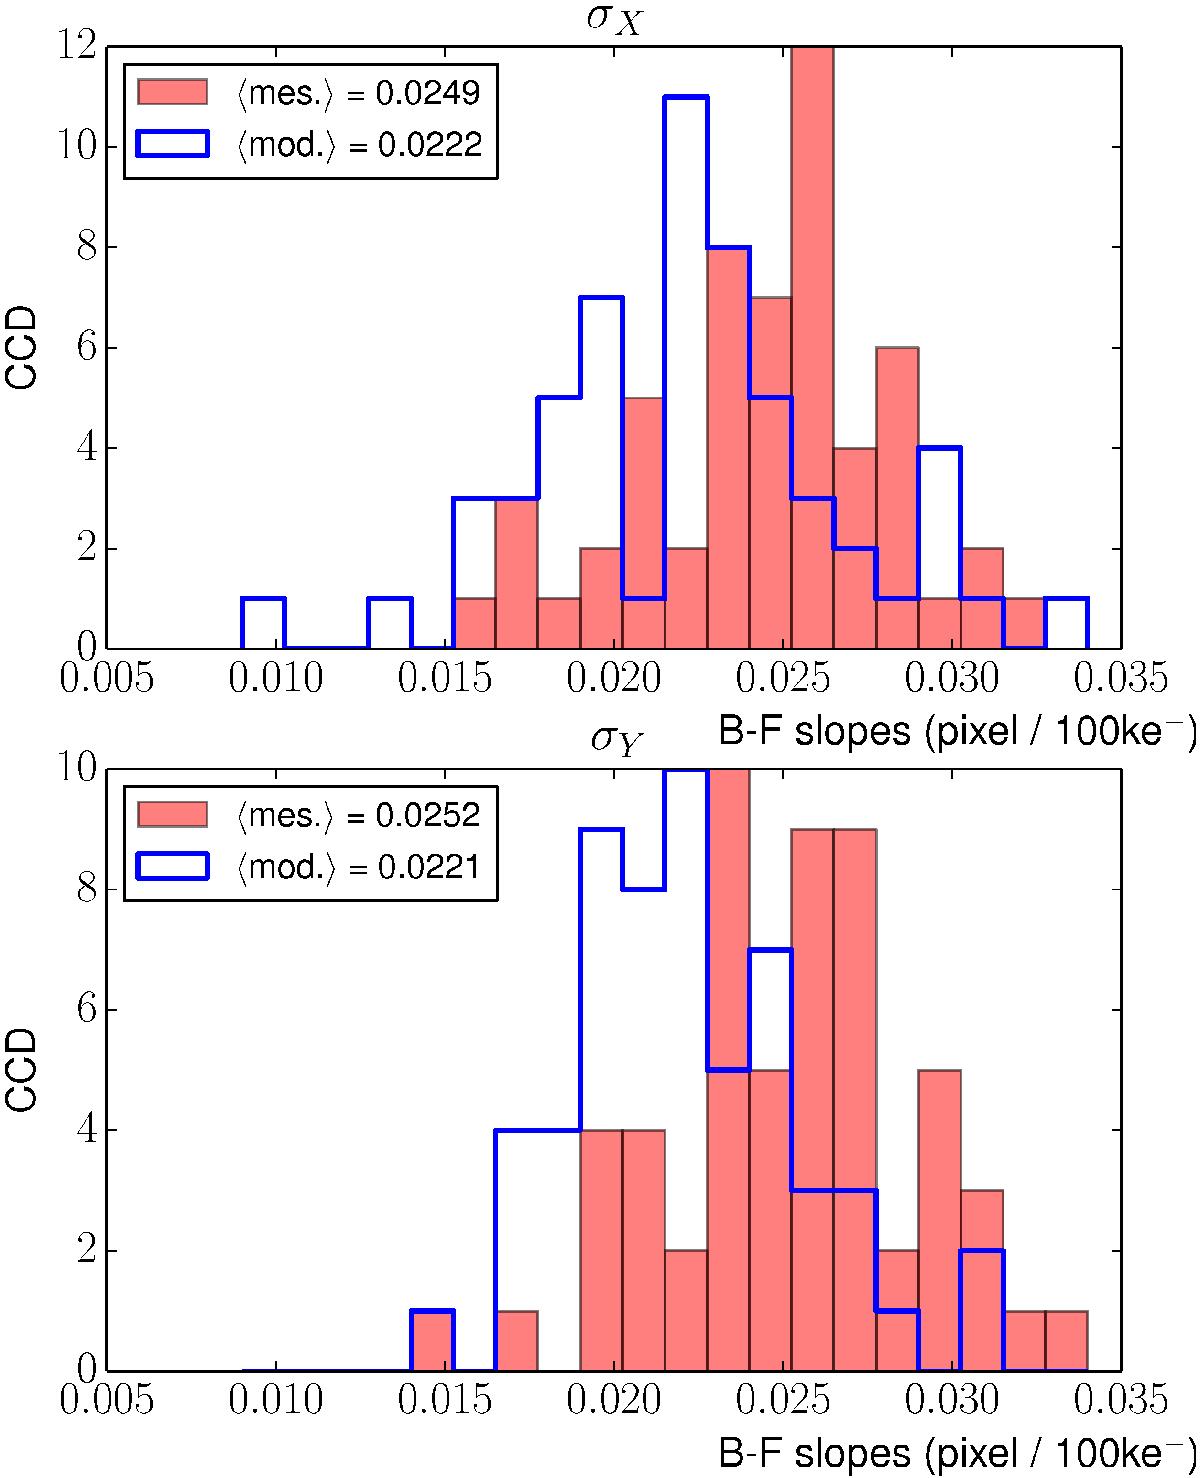
Comparison of measured and simulated brighter-fatter slopes for DECam r-band. There are 57 CCDs over the 62 that are presented: we reject five CCDs for which at least one of its amplifiers has a reduced χ2 for the linear fit of the correlation R1,1 that is above 3. Astronomical images are being corrected at the pixel level to take non linearities detected from looking at flatfield mean fluxes versus exposure time into account. This increases the measured slopes by about 60%. While this correction is quite important, very small changes in the way non-linearities are fitted could account for the disagreement between measurements and model.
Current usage metrics show cumulative count of Article Views (full-text article views including HTML views, PDF and ePub downloads, according to the available data) and Abstracts Views on Vision4Press platform.
Data correspond to usage on the plateform after 2015. The current usage metrics is available 48-96 hours after online publication and is updated daily on week days.
Initial download of the metrics may take a while.