Fig. 17
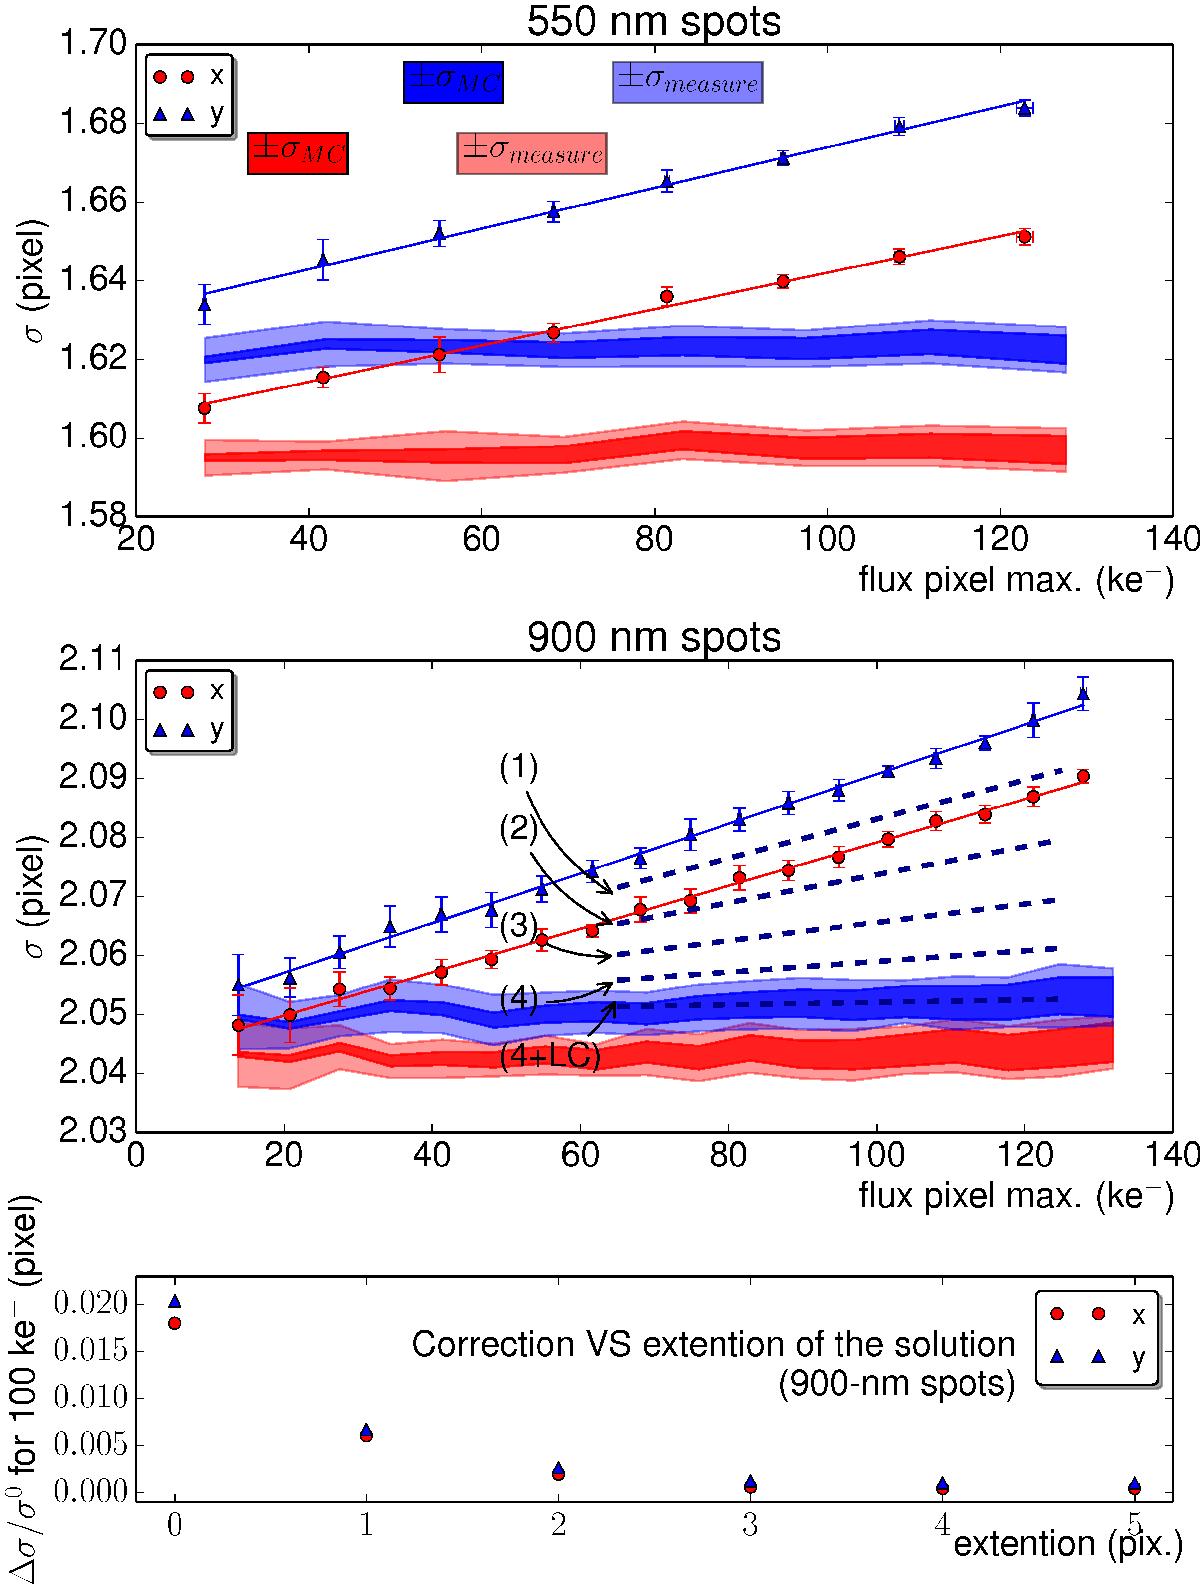
Spot size along X and Y directions for 550 nm spots (top panel) and 900 nm spots (middle panel) on the CCD E2V-250. Raw spots are fitted with lines and measurements after redistribution of charges with the inverse model are shown with shaded area. Light colors correspond to dispersion coming from spot size measurements while darker colors represent the propagation of statistical 1σ uncertainties on correlations coefficients given that 50 pairs of flats were used. The five dashed lines on the lower panel indicate the redistribution prediction for the spot broadening in the Y direction when taking an increasingly large area of pixel correlations into account. It ranges from ±1 pixels distances to ±4 pixels and ±4 pixels plus the limit condition (4 + LC) established in the previous section. In the latter case, it is found that the correction restores the invariance of the PSF size with respect to increasing flux with a relative precision below 5‰ at 550 nm and 3.4‰ at 900 nm. The bottom panel represents the brighter-fatter effect as a function of the extension of the solution with the limit condition taken into account. It shows that the boundaries displacement at distance further than 4 pixels have a negligible impact on the solution.
Current usage metrics show cumulative count of Article Views (full-text article views including HTML views, PDF and ePub downloads, according to the available data) and Abstracts Views on Vision4Press platform.
Data correspond to usage on the plateform after 2015. The current usage metrics is available 48-96 hours after online publication and is updated daily on week days.
Initial download of the metrics may take a while.