Fig. 16
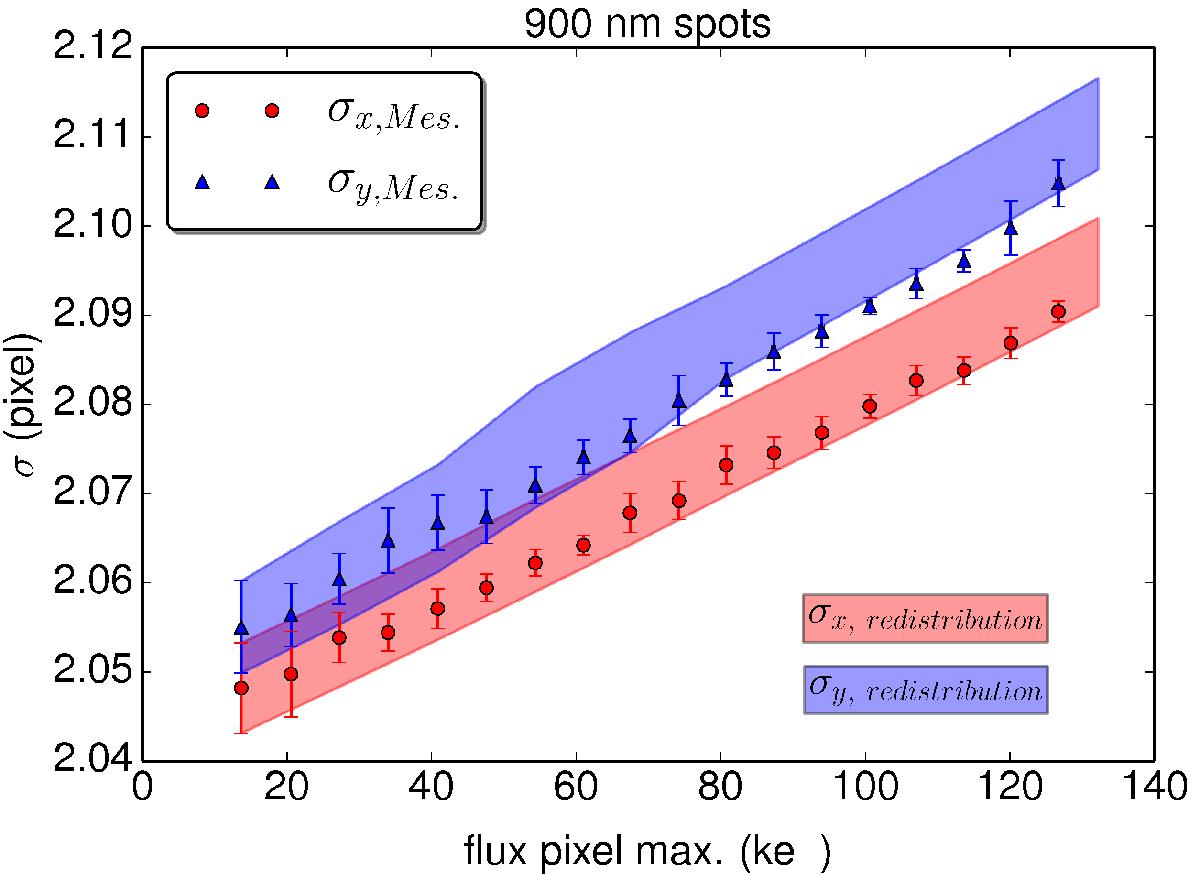
Comparison between the broadening of spots from the redistribution and the data (CCD E2V-250, 900 nm spots). The ten low flux spots (≈13 ke−) are redistributed after increasing normalization to cover dynamical range (shaded areas). This shows the ability of our model of pixel effective size to reproduce the spot size increase observed in the brighter-fatter effect.
Current usage metrics show cumulative count of Article Views (full-text article views including HTML views, PDF and ePub downloads, according to the available data) and Abstracts Views on Vision4Press platform.
Data correspond to usage on the plateform after 2015. The current usage metrics is available 48-96 hours after online publication and is updated daily on week days.
Initial download of the metrics may take a while.