Fig. 15
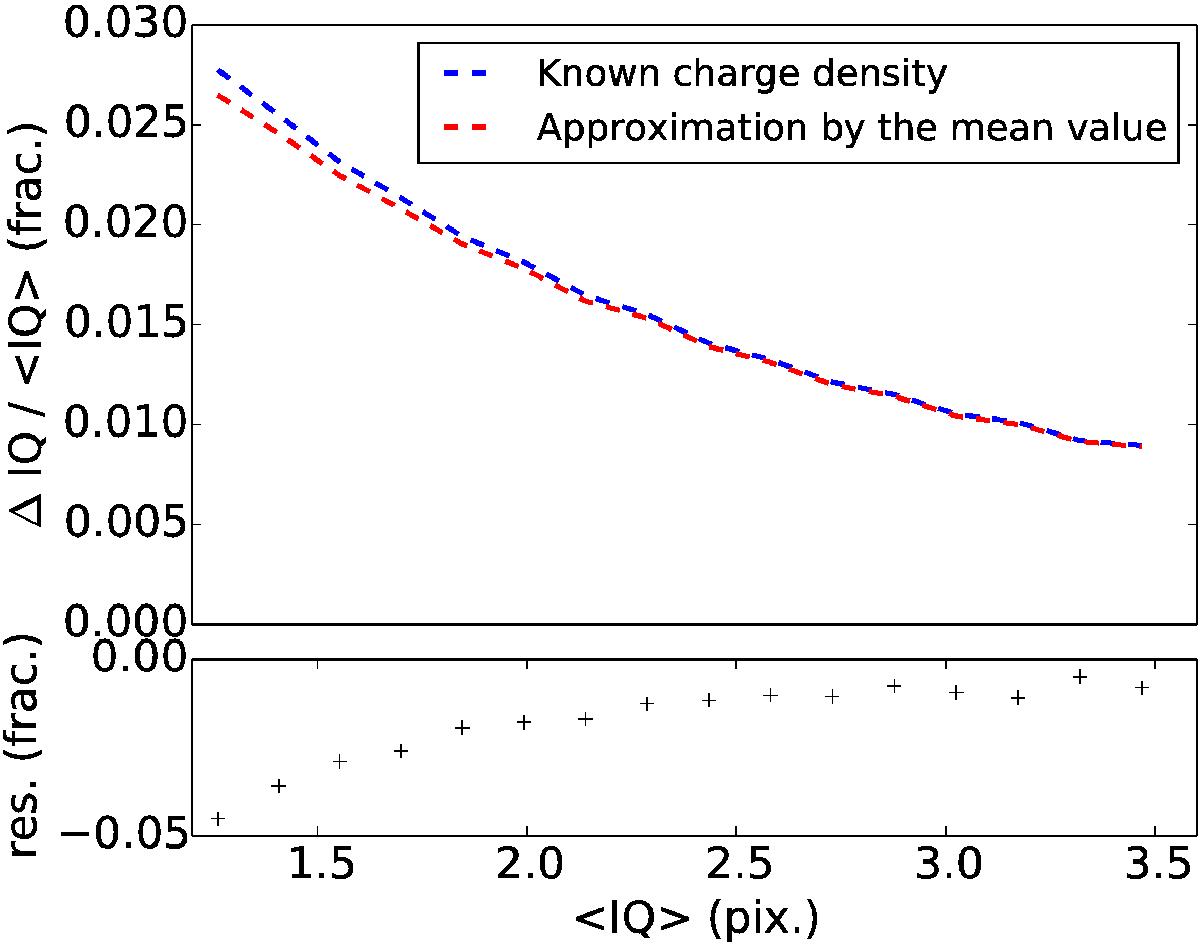
Top panel: IQ variation for 100 ke− (peak) spots after having redistributed the charges (on a range comparable to what was presented for DECam on Fig. 3). The accuracy of the approximation of the interpolation method (in red) is compared with the result found using the exact charge density (in blue). Bottom panel: residuals. For an IQ of 1.6 pixel, such as 550 nm spots on CCD E2V-250, the approximation introduced an underestimate below 0.1% on the size of the spot, which is less than 5% of the amplitude of the effect.
Current usage metrics show cumulative count of Article Views (full-text article views including HTML views, PDF and ePub downloads, according to the available data) and Abstracts Views on Vision4Press platform.
Data correspond to usage on the plateform after 2015. The current usage metrics is available 48-96 hours after online publication and is updated daily on week days.
Initial download of the metrics may take a while.