Fig. 14
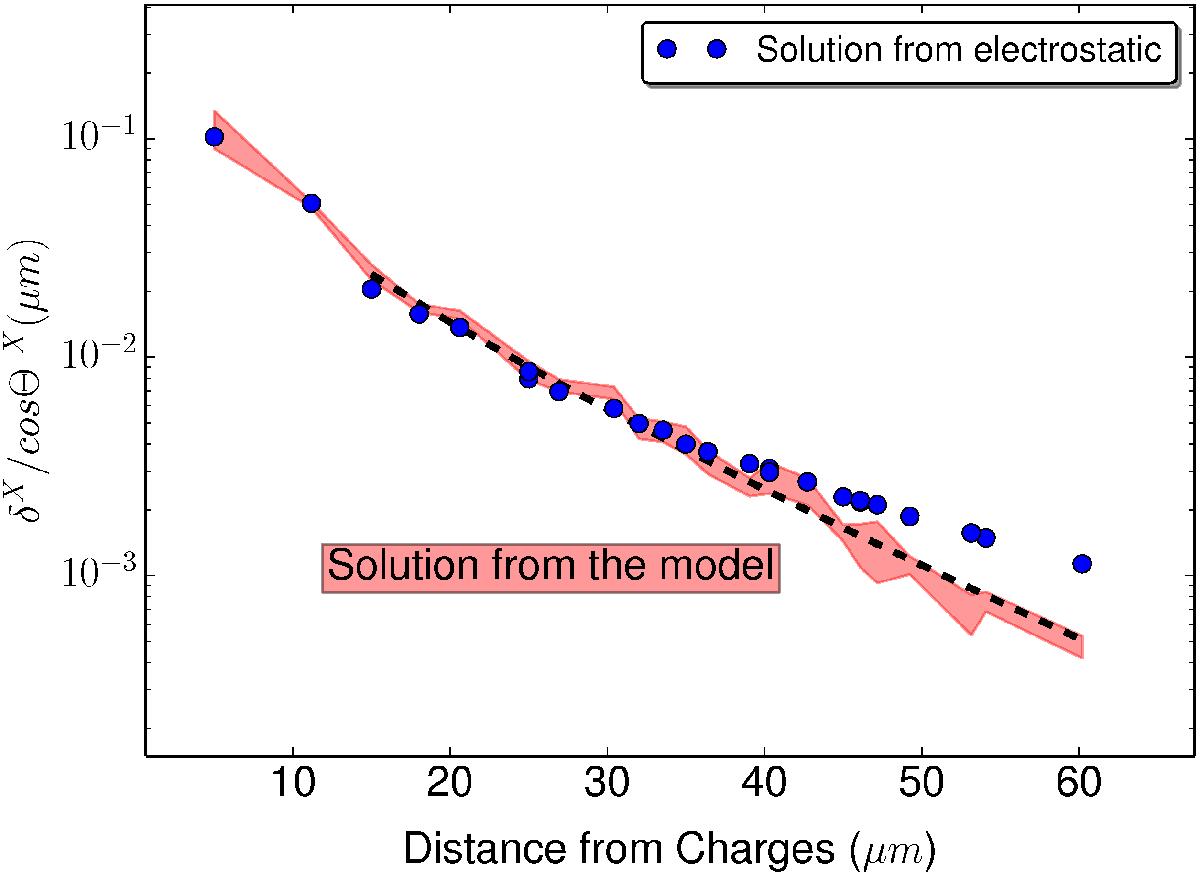
Boundary displacements (![]() ke−) for the CCD E2V-250 projected in the direction radial from the charges and represented as a function of the distance. We divide the coefficients by cosθX to display the “radial part” of those coefficients (the f(r) function of Eq. (18)). The result from the electrostatic simulation is indicated by the blue points, while the solution of the model with the propagation of the ±1σ uncertainties from the correlations measurement is indicated by the red shaded area. Its irregular shape is coming from the X/Y anisotropy in correlation coefficients, which is ignored in the simulation. The dashed line indicates the Ei function on the range where the constraint on pairs of adjacent pixels is used. A ±5σ variation of its p1 parameter has an insignificant effect on the prediction of the brighter-fatter slope.
ke−) for the CCD E2V-250 projected in the direction radial from the charges and represented as a function of the distance. We divide the coefficients by cosθX to display the “radial part” of those coefficients (the f(r) function of Eq. (18)). The result from the electrostatic simulation is indicated by the blue points, while the solution of the model with the propagation of the ±1σ uncertainties from the correlations measurement is indicated by the red shaded area. Its irregular shape is coming from the X/Y anisotropy in correlation coefficients, which is ignored in the simulation. The dashed line indicates the Ei function on the range where the constraint on pairs of adjacent pixels is used. A ±5σ variation of its p1 parameter has an insignificant effect on the prediction of the brighter-fatter slope.
Current usage metrics show cumulative count of Article Views (full-text article views including HTML views, PDF and ePub downloads, according to the available data) and Abstracts Views on Vision4Press platform.
Data correspond to usage on the plateform after 2015. The current usage metrics is available 48-96 hours after online publication and is updated daily on week days.
Initial download of the metrics may take a while.