Fig. 13
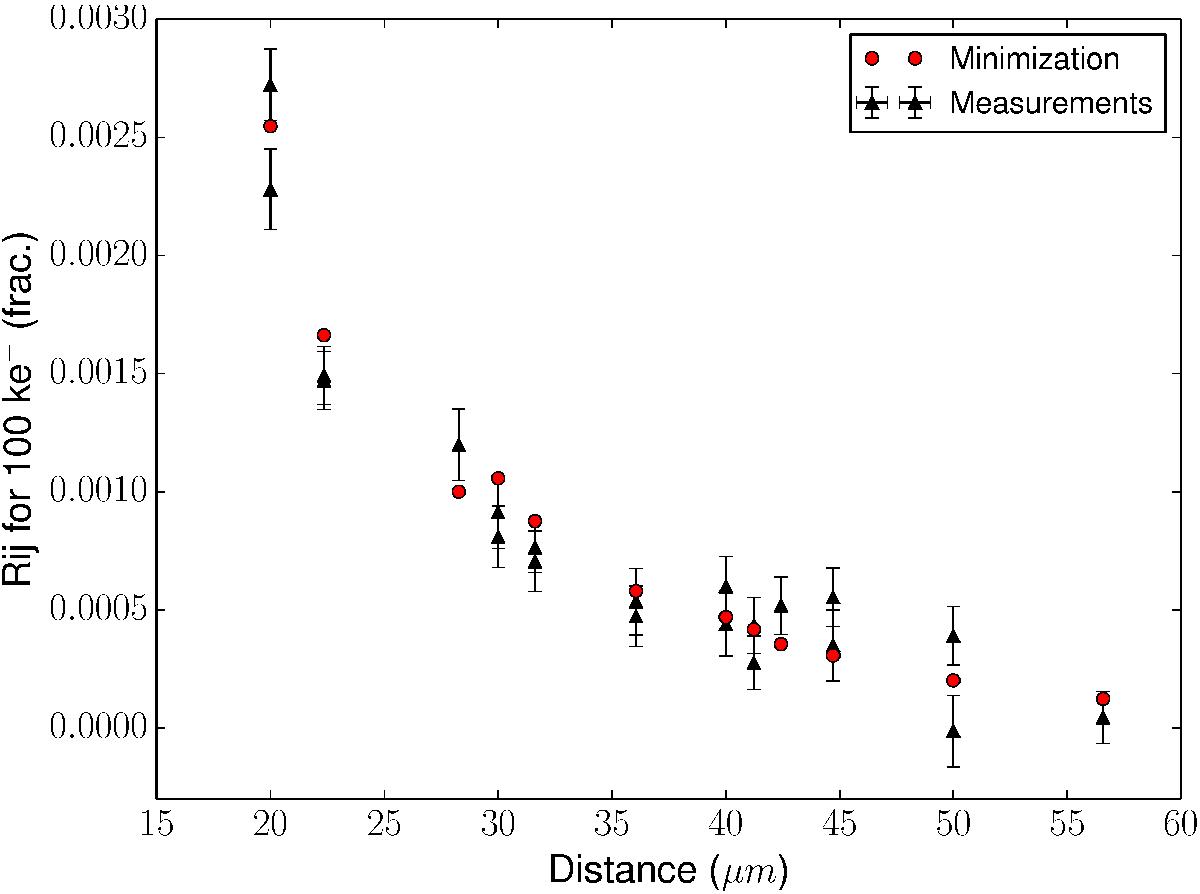
Correlation coefficients of the non-nearest neighbors for the CCD E2V-250 are represented as a function of their distance (black triangles) and the correlation coefficients reconstructed from a χ2 minimization (red circles) using an Exponential Integral function. This function is used to estimate the last boundaries displacement.
Current usage metrics show cumulative count of Article Views (full-text article views including HTML views, PDF and ePub downloads, according to the available data) and Abstracts Views on Vision4Press platform.
Data correspond to usage on the plateform after 2015. The current usage metrics is available 48-96 hours after online publication and is updated daily on week days.
Initial download of the metrics may take a while.